


Spare Parts Depot Stocking: Deciding What to Stock Where
A part in the wrong depot ties up money where it isn't needed, while the customer whose equipment fails elsewhere waits for it to be shipped in. Across the industry, excess and obsolete stock already runs at 15–20% of inventory value.

With limited inventory and hundreds of depots, past usage alone can't tell you where each part should go. A failure rate and a periodic installed-base count don't close the gap. The better decision comes from predicting where failures are likely next.
History runs out at the depot
For one part at one depot, the demand record is thin. In our experience, 70–90% of parts in the service catalog already have intermittent demand. Divide one part's demand across hundreds of depots and most have too few events on record to say what comes next.
IBM hit this limit in its own service operation. Even for mature equipment models, it found historical demand insufficient to forecast each combination of postal code and contract type. So it forecast at country level and allocated demand according to the equipment installed in each postal code.
Thin data is only part of the problem. A review in the International Journal of Forecasting found that most forecasting methods ignore what generates demand. Shipments show where a part went, not what drove demand there: which equipment is running, under which contracts, how it's maintained and what state it's in.
An installed base count treats all equipment alike
Splitting a forecast in proportion to installed-base counts helps, but it treats all equipment alike. Researchers studying stock placement at IBM found that using installed-base data cut costs by 1–16% for a small installed base and 1–58% for a large one, compared with IBM's existing policy. At the low end of both ranges, the saving was just 1%.
Two depots with the same installed-base count receive the same share of the forecast, even if one serves older equipment running at higher intensity in a harsher climate. Applying the same failure rate to both doesn't capture those differences.
Many factors differ for the equipment each depot serves: duty cycle, age and configuration, heat and chemical exposure, a design change in one set of models, a defect in one production lot, the maintenance schedule and the warranty mix. Any of them can matter for one part and mean nothing for the next. In two case studies, including the operating environment changed forecasted demand by 20% and 40%.
What does prediction change for the planner?
Combine those factors with installed-base and service data, and you can forecast demand for each part at each location instead of dividing a network total. The planner gets a 52-week forecast with a range of uncertainty.
A forecast built this way can show demand gathering in a region before shipments do. For illustration, technicians who keep documenting a recurring seal failure in humid climates point to a geographic concentration of demand that shipment history can't reveal.
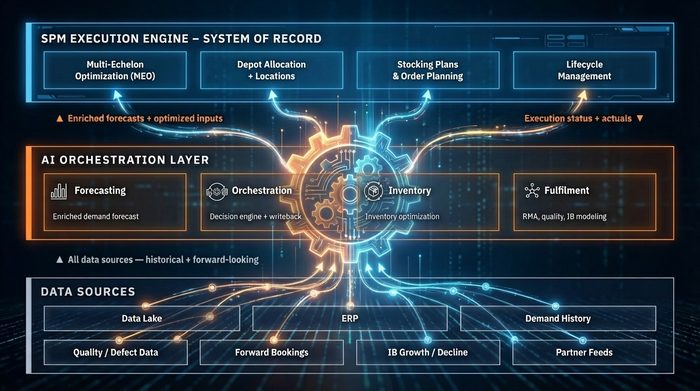
Bruviti's specialized service AI works alongside the service parts planning system a company already runs. Its AI Operating Layer brings equipment and service data into the forecasts that system uses to decide where to hold stock.
The AI operating layer first deals with thin history by changing the question from "what did this part do?" to "what did similar parts do in similar contexts?" It finds those peers through its service ontology, a map of how equipment, parts, failure modes and service history relate, which connects records that share no part number. The closer a peer is to the part in subsystem, function, operating conditions and failure mode, the more weight it carries.
The AI layer then estimates each part's failure risk from the equipment it is installed in and how that equipment is used, using a statistical method called survival analysis. Signals that arrive ahead of shipments feed the forecast too: quality events, warranty claims, technician notes, forward bookings and engineering changes. To decide which forecasting methods to trust, the layer repeatedly tests them against past demand, part by part and location by location.
The forecasts are then reconciled top-down and bottom-up, so the depot numbers agree with the network number. From them come adjusted safety stocks, reorder points and stocking locations, written back into the systems planners already use. Planners see the exceptions, such as new parts, data gaps, spikes and drift, with the reasoning attached.
The planning system then allocates stock to depots against service levels and cost.
What it takes to make this work
Location forecasts depend on accurate records of where equipment is. Relocations that go unreported, purchasing offices recorded instead of installation sites and resellers who hide the final buyer can all distort the picture. Errors concentrated in one region can affect stocking decisions even when overall accuracy looks good. Check for those patterns, not just overall installed-base accuracy.
Failure codes, tickets and warranty claims need to be available as inputs, and at least three years of history is typical. The method doesn't rest on telemetry alone, which matters for fleets that aren't connected. The operation also has to be able to act: rigid min/max policies and quarterly reviews capture less of the value.
Less inventory, better parts availability
Across deployments, Bruviti customers have seen stockouts fall by 40%+ and inventory value and carrying costs fall by 15–20%. That 15–20% is a cut in what they hold and what holding it costs, a different measure from the industry's excess-stock share. Cutting stockouts usually means holding more inventory, so lowering both together is the outcome good placement is meant to produce.
A semiconductor equipment manufacturer cut its 4-week forecast error from 17–18% to under 3% by connecting quality, install base lifecycle and field service signals. The manufacturer had $50M+ in quarterly spend and saved $2M+ a year. It shows how far those signals can cut error in the forecast used to make stocking decisions.
The information needed to predict parts demand already exists across your service operation. Bruviti's AI Operating Layer connects that information, forecasts demand for each part at each location, and feeds those forecasts into the planning system you already run. The result is fewer stockouts with less inventory, because more of the parts you hold are where customers need them.