The Four Structural Gaps in Modern SPM Systems
Service parts management systems represent decades of investment in operations research, inventory theory, and supply chain optimization. Leading SPM platforms serve thousands of organizations managing complex aftermarket supply chains.
These are not simple systems. Multi-echelon optimization, probabilistic demand modeling, service-level-driven stocking policies - the mathematical sophistication is real.
So why do most service organizations still struggle with the same core challenges: forecast accuracy that disappoints, planning coverage that's incomplete, and planners who spend more time on manual overrides than strategic work?
Service parts planning is uniquely complex. Demand is intermittent - zero usage for months, then unpredictable spikes that overwhelm traditional statistical methods. Parts must be supported for decades after production ends. Supersessions, end-of-life transitions, warranty returns, and repair/return flows create planning complexity that production-oriented tools were never designed to handle. Fill rate targets of 95%+ leave no room for error, while inventory carrying costs on slow-moving parts tie up significant capital.
The answer lies in four structural gaps that are common across all major SPM platforms. These aren't bugs or configuration issues. They're architectural characteristics - byproducts of design decisions that made sense when these platforms were built, but create specific limitations in today's enterprise environment.
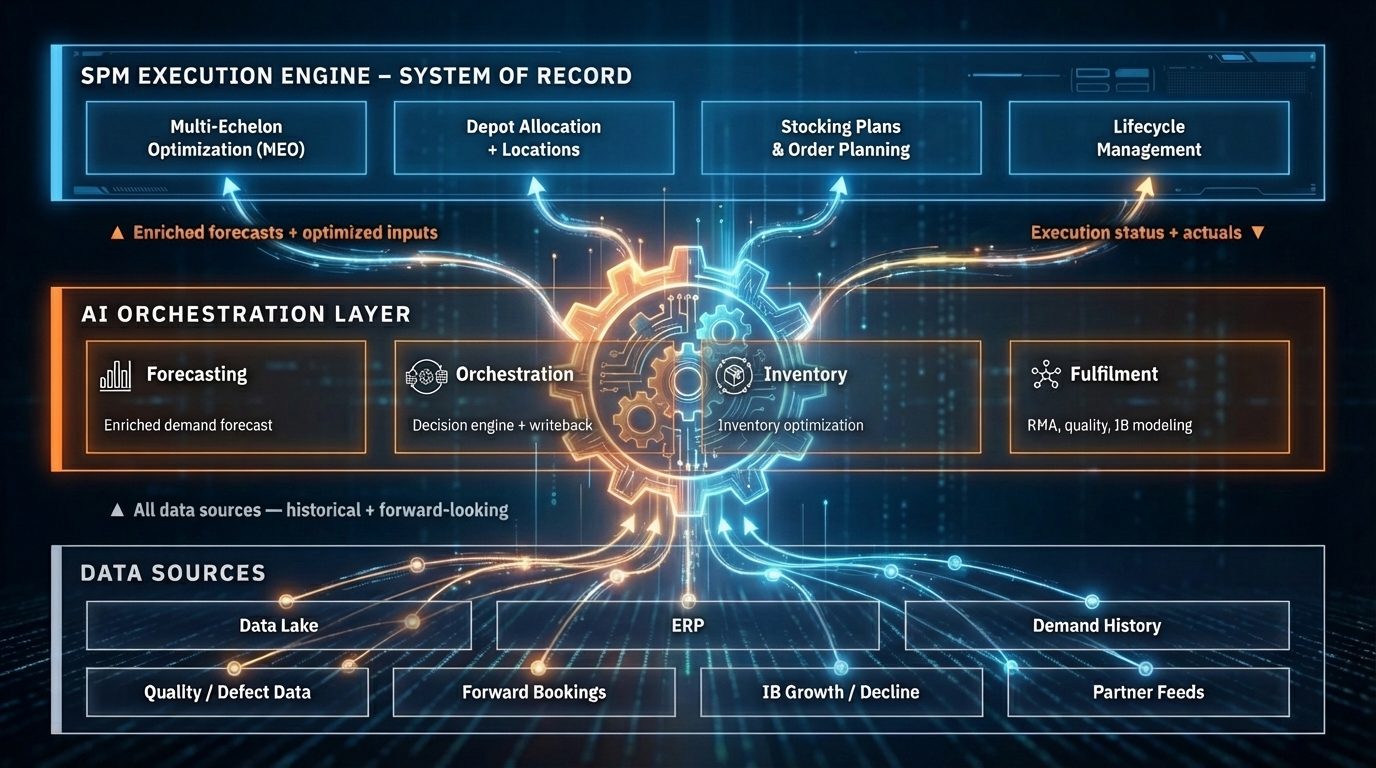
Gap 1: The Demand Signal Boundary
Every SPM system has an ingestion boundary - the set of data sources it was designed to consume for demand planning.
For most platforms, this boundary includes:
- Historical shipment/consumption data: What was shipped from each depot over time
- Install base data: What equipment is in the field (often updated quarterly)
- Basic causal factors: Seasonal patterns, trend adjustments
- Planner overrides: Manual adjustments based on domain knowledge
Now consider the full landscape of signals that influence service parts demand:
| Signal Source | Demand Impact | Typically in SPM? |
|---|---|---|
| Historical shipments | Baseline demand pattern | Yes |
| Install base | Population-driven demand | Partially |
| Quality/MES data | Early-life failure surges, quality excursions | No |
| Field technician notes | Recurring failure patterns, emerging issues | No |
| Forward bookings / CRM | Customer expansion, contraction signals | No |
| IoT / sensor data | Condition-based maintenance triggers | No |
| Dealer intelligence | Regional demand shifts, competitive dynamics | No |
| Product lifecycle stage | End-of-life, end-of-warranty demand shifts | Rarely |
| Engineering changes | Part supersession demand transfer | Partially |
| Warranty claims data | Failure pattern indicators | Rarely |
The signals marked "No" directly influence parts demand but sit outside the SPM's ingestion boundary. The planning system optimizes from a partial picture - and the resulting forecast accuracy reflects that partiality.
This is why forecast accuracy plateaus. The ceiling isn't in the model. It's in the input.
Gap 2: The Scale Ceiling
Service parts planning is a high-dimensional problem. The number of planning decisions scales as the product of:
Parts x Locations x Time periods x Condition codes
For a large service organization - 200,000 part numbers, 800 depot locations, 52 weekly time periods, 3 condition codes - that matrix contains billions of decision points.
SPM systems process this matrix in batch windows. The system runs overnight (or over a weekend), crunches through as much of the matrix as it can within the processing window, and presents results to planners by morning.
The processing capacity is finite. When the matrix exceeds capacity, the standard approach is subsetting:
- Plan A-items (top 20-30% by value or criticality) with full optimization
- Plan B-items with simplified policies
- Apply rule-of-thumb min/max policies to C-items
- Ignore or minimally manage the long tail
This means the majority of your parts catalog receives limited or no systematic planning attention. The tail SKUs that fall outside the planning boundary are exactly the ones that create expensive surprises: unexpected stockouts leading to expedited shipments, or excess inventory building silently on parts that should have been phased down.
The scale ceiling isn't a system deficiency. It's a physics problem: batch architectures have finite throughput, and the service parts matrix exceeds it at enterprise scale.
Gap 3: Signal Integration Rigidity
SPM systems were designed for a defined set of inputs. Adding a new data source requires:
- Connector development: Building the interface between the source system and the SPM
- Data mapping: Translating source data into SPM-compatible formats
- Validation: Ensuring data quality meets planning requirements
- Testing: Verifying that the new signal improves (rather than degrades) planning output
- Deployment: Rolling the integration into production
In most SPM environments, this process takes 3-6 months per data source. It requires IT resources, SPM vendor involvement, and extensive testing.
The practical consequence: valuable demand signals sit unused. The quality team knows about a component failure trend. The field service team has documented a recurring issue. The CRM shows forward bookings from major accounts. This intelligence is available today, but the path to getting it into the planning system takes quarters, not days.
This isn't about API availability or modern interfaces. It's about the fundamental architecture: SPM platforms were built around fixed input schemas. Each new signal source is a custom integration project.
In an environment where demand patterns shift faster than integration cycles, this rigidity becomes a competitive constraint.
Gap 4: The Recommendation-to-Execution Gap
SPM systems produce recommendations: stocking level changes, replenishment orders, transfer orders between depots, reorder suggestions, obsolescence flags.
These recommendations are generally sound. The optimization math works.
But between the recommendation and the action, there's a human:
- Planner opens the recommendation queue (thousands of items)
- Planner reviews each recommendation against domain knowledge
- Planner overrides recommendations that don't match their understanding
- Planner approves the remainder
- Approved actions are pushed to ERP/execution systems
- Exceptions are manually tracked and followed up
Override rates of 30-50% are common in enterprise SPM environments. Not because the system is wrong, but because the planner has context the system doesn't (which relates back to Gap 1).
The total cycle time from recommendation generation to execution can range from hours to days. During that time, the conditions that generated the recommendation may have changed. Plans age. Stale recommendations create waste.
Planner bandwidth becomes the operational bottleneck. Not processing power, not optimization capability - human review capacity limits the throughput of the entire planning system.
Why These Gaps Are Structural
These four gaps share a common characteristic: they can't be solved by better configuration, more training, or upgrading to the latest release of the SPM platform.
They're structural because they reflect the fundamental architecture of how SPM systems were designed:
- Input boundaries were defined when the available demand signals were narrower
- Batch processing was the standard when these architectures were established
- Fixed schemas made sense before enterprises had dozens of signal-generating systems
- Human-in-the-loop was the only option before AI could handle confidence-based decision routing
Solving structural gaps requires a structural response: an additional architectural layer purpose-built for signal fusion, continuous modeling, rapid integration, and automated execution.
That's the role of an AI operating layer. Not replacing the SPM execution engine - but closing the gaps between what it can do and what the enterprise needs it to do.
More in This Series
This article is part of a three-part series on AI operating layers for service parts management:
- From 50% to 90%+ Forecast Accuracy: What Changes With an AI Layer quantifies what happens when the demand signal boundary is removed and the planning system finally sees the full picture.
- Why Your SPM Needs an AI Operating Layer lays out the combined architecture and how it complements your existing planning system.
Bruviti builds AI operating layers for service supply chains. We'd love the opportunity to show you how we close these structural gaps for enterprise customers.