

Connected Data Fault Detection
Fuse multi-modal signals into one intelligent view and auto-link anomalies to failure modes. Forecast critical drifts 7-14 days in advance with ≥90% precision.
Challenge
Engineering teams juggle fragmented data across vibration, temperature, pressure gas flow, controller logs, and process parameters. Signals sit in separate historians, MES SCADA, and log files with inconsistent clocks, units, and naming. Root causes often span cross domain interactions, such as chamber pressure plus heater drift indicating a sticking valve. Investigations take days and rely on tribal knowledge and manual overlays—delaying fixes and masking true failure modes.
fuse multi modal signals into one intelligent view and auto link anomalies to failure modes. Forecast critical drifts 7–14 days in advance with ≥90% precision, cut time to root cause by ≥60%, and auto tag ≥70% of anomalies with interpretable explanations and compliant system updates.
Solution: How the AI layer changed the operating model
Learning and setup
Powered by Bruviti’s AI Operating Layer, the agent solution applied predictive, forecasting, and policy models with ontology driven graph reasoning, multivariate time series anomaly detection, causal inference, and drift detection. Training data came from historical signals, controller and equipment logs, alarm and event history, SPC and FDC data, recipe and setpoint changes, maintenance tickets, calibration records, and OEM manuals mapped to the ontology. The agent recognizes tag names, timestamps and rates, units, tool and chamber IDs, recipe and lot IDs, setpoints and limits, alarm codes, work orders, and operator notes.
Workflow orchestration
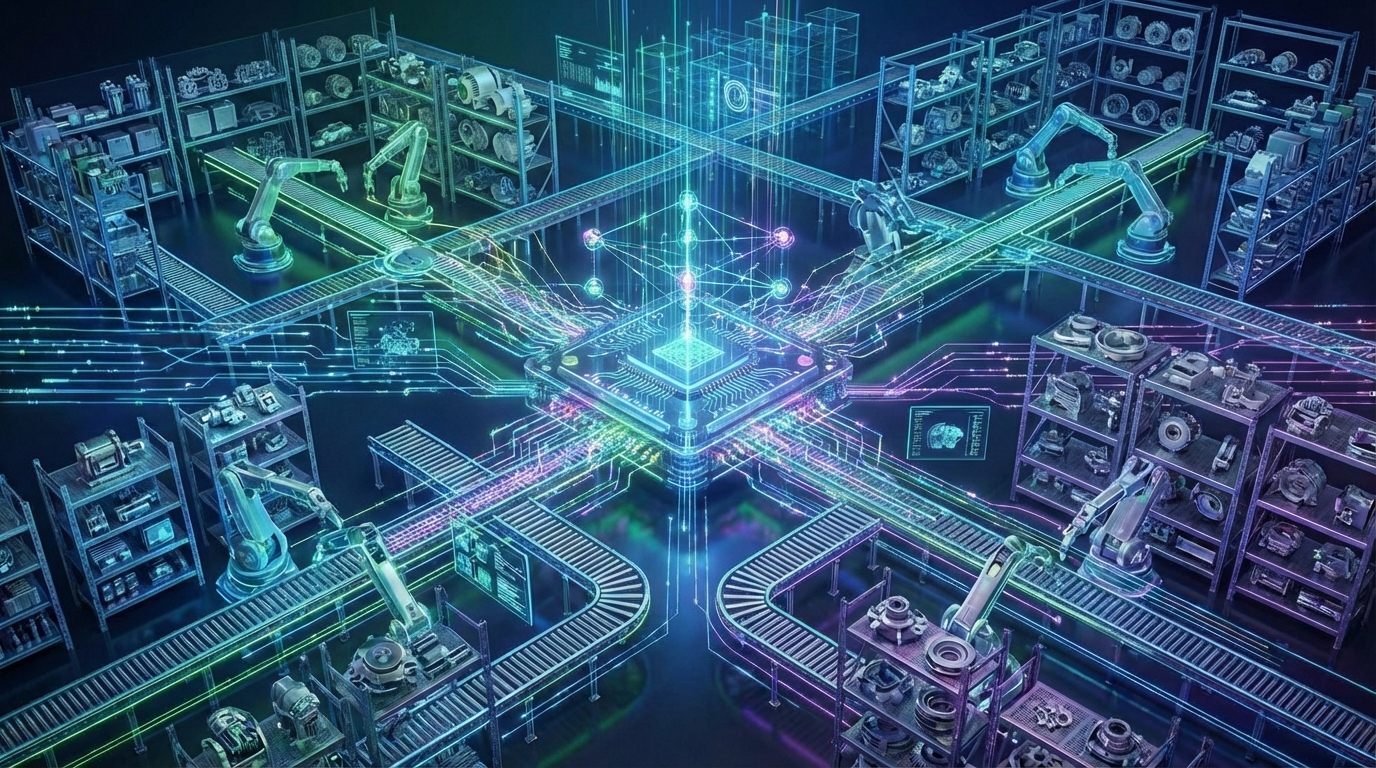
The AI agent analyzes incoming signals, extracts identifiers, and determines the correct workflow path: align clocks, normalize units, correlate signals, test causal drivers, forecast drift, or open a maintenance action. It navigates historians, MES SCADA, CMMS ERP, and the data lake, mirroring the steps a reliability engineer would follow. Orchestration logic branches when rules apply—for example, suppress alerts if the anomaly aligns with a planned recipe change, or escalate when a protected limit is breached—while ensuring compliance at every step.
Execution and resolution
The AI agent validates and resamples streams, de noises, extracts features, detects multivariate anomalies, discovers correlations and causal drivers, forecasts drifts, maps patterns to failure modes, and generates ranked, explainable recommendations. Results arrive in minutes, with work orders and dashboards updated across connected systems. Exceptions—such as sensor faults, missing tags, excessive clock drift, or low model confidence—are routed to engineers with full context attached.