Support engineers waste hours parsing BMC logs manually while critical server issues escalate to costly on-site interventions.
Bruviti deployment data shows roughly 70% of case time was spent reviewing microscopy images and logs before automation. Builders cut that by feeding raw log and image streams into a specialized model that surfaces the fault signature first, so engineers validate a conclusion instead of hunting for one. The review bottleneck stops gating resolution.
Support engineers spend hours manually correlating BMC events, IPMI sensor data, and system logs across hundreds of servers. Pattern recognition requires deep expertise that takes years to develop.
Remote sessions require juggling BMC interfaces, IPMI command-line tools, vendor-specific diagnostics, and custom scripts. No unified API layer means building integrations from scratch for each tool.
Without automated root cause identification, complex thermal or power anomalies get escalated prematurely. Remote resolution rates plateau below 60% because support engineers lack real-time diagnostic intelligence.
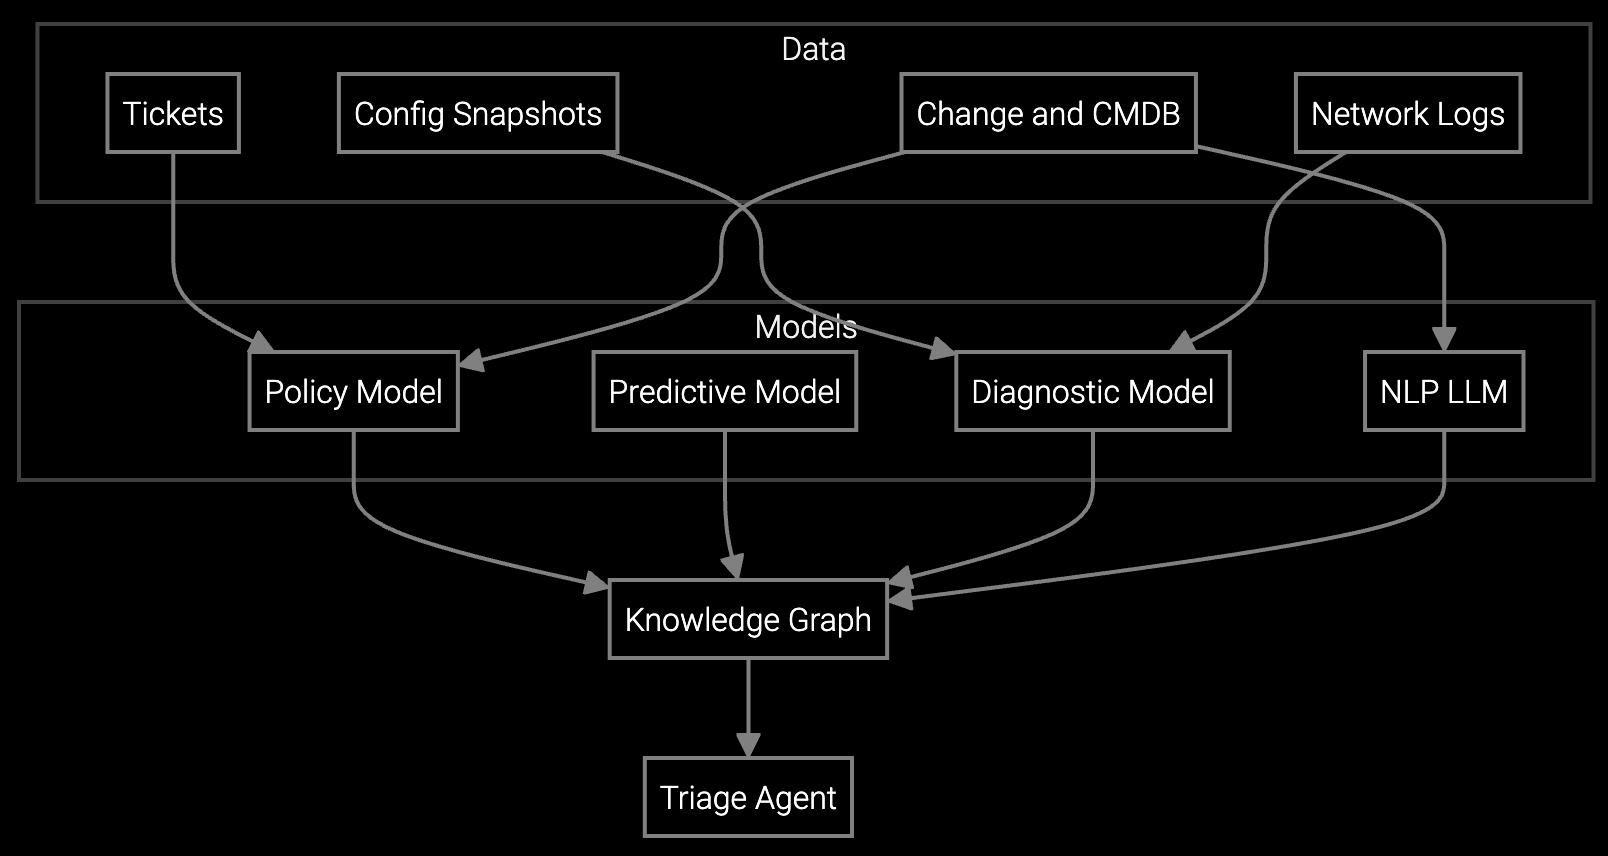
The platform provides pre-trained telemetry parsing models that understand BMC event codes, IPMI sensor thresholds, and hardware failure signatures across major server vendors. Python SDKs let you ingest live streams from IPMI interfaces, apply pattern matching to thermal anomalies or power fluctuations, and trigger custom remediation workflows—all without rebuilding NLP or time-series models from scratch.
API-first architecture means you control data flow. Connect to existing remote access platforms, route diagnostics through your authentication layer, and store parsed insights in your own data lake. TypeScript bindings enable frontend engineers to build custom dashboards that surface root cause analysis directly in remote session tools your team already uses.
Data center OEMs manage remote support across thousands of servers spanning multiple hardware generations, each with different BMC firmware versions and IPMI implementations. Support engineers need to diagnose power supply failures in legacy 2U servers while simultaneously troubleshooting NVMe thermal throttling in latest-generation compute nodes.
Hyperscale customers demand 99.99% availability SLAs, which means remote diagnostic delays directly threaten contract renewals. Every minute spent manually parsing logs increases the risk of SLA violations. Python SDKs let you build automated diagnostic agents that parse BMC event logs in real time, identify thermal hot spots from IPMI sensor data, and trigger pre-approved remediation scripts—all within your existing orchestration framework.
The Python SDK provides async listeners that subscribe to IPMI event streams and Redfish webhooks. You can pipe parsed events into your existing ticketing system or remote session tool using standard REST APIs. No need to replace remote access platforms—just augment them with real-time diagnostic intelligence.
Yes. The platform includes fine-tuning APIs that let you retrain pattern matching models on your own historical BMC logs and RMA data. Training runs in your environment using your compute resources, so proprietary failure signatures never leave your data center. Model weights stay under your control.
The SDK includes pre-built parsers for Dell iDRAC, HPE iLO, Supermicro IPMI, and generic Redfish interfaces. Each parser handles vendor-specific event codes and sensor formats. You write diagnostic logic once using a unified API, and the platform handles translation across BMC implementations.
All diagnostic workflows are written in Python using standard libraries—no proprietary DSL or configuration formats. Model inference runs via open-standard ONNX runtime, so you can export trained models and run them anywhere. Data ingestion uses your choice of message queue (Kafka, RabbitMQ, etc.), not a platform-specific broker.
Data flow is entirely under your control. The SDK processes telemetry streams in your environment and writes parsed insights to your designated storage layer. No telemetry data leaves your infrastructure unless you explicitly configure external replication. You own the data pipeline end to end.

Software stocks lost nearly $1 trillion in value despite strong quarters. AI represents a paradigm shift, not an incremental software improvement.
Function-scoped AI improves local efficiency but workflow-native AI changes cost-to-serve. The P&L impact lives in the workflow itself.

Five key shifts from deploying nearly 100 enterprise AI workflow solutions and the GTM changes required to win in 2026.
Get API documentation and sandbox access to start parsing BMC telemetry in your environment.
Access Developer Resources