When every minute of fab downtime costs $17,000, fragmented remote access tools and manual log parsing burn time you can't afford.
Bruviti deployment data shows knowledge-driven root cause analysis cuts MTTR by 40 to 60% across fragmented tool support. When remote diagnostics span dozens of disconnected tool types, AI unifies the signals, suggests top causes on 70% or more of incidents, and ends duplicate investigations that slow every fab support engineer down.
Support engineers juggle 5-7 different remote tools across lithography, etch, and metrology equipment. Each vendor uses proprietary access protocols, forcing context switches that delay resolution and increase session complexity.
Log files from process chambers arrive in dozens of formats—some XML, some proprietary binary, some plain text with vendor-specific schemas. Parsing them manually to identify recipe drift or contamination patterns takes hours per incident.
When remote sessions fail, handoff to field service lacks structured context. Support engineers retype findings into different systems, losing telemetry correlation and forcing field teams to re-diagnose from scratch.
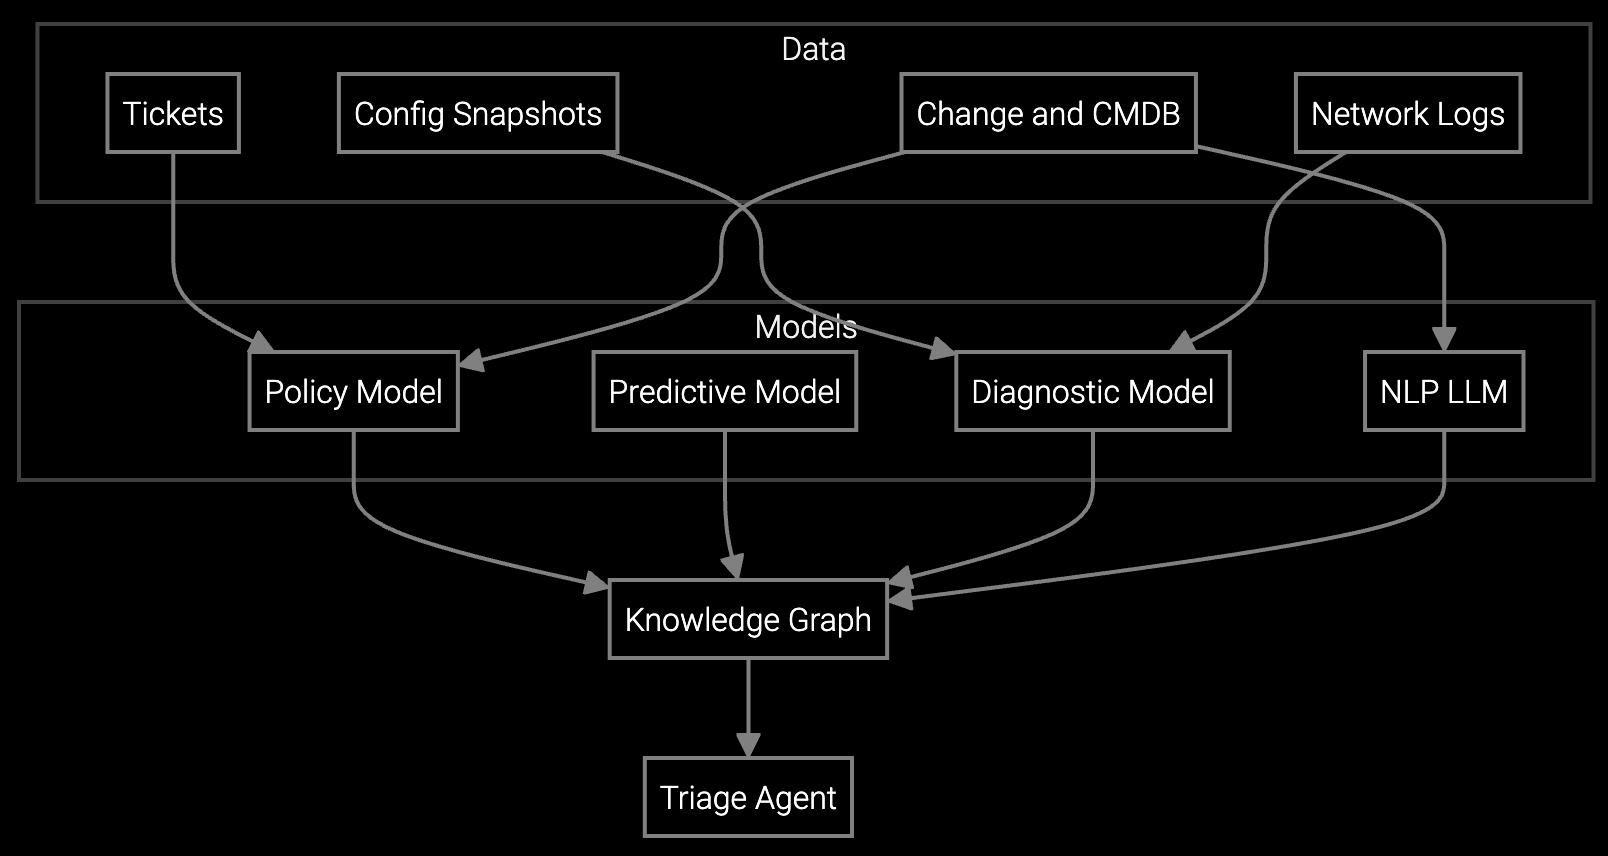
Bruviti's platform provides Python and TypeScript SDKs that ingest telemetry from heterogeneous semiconductor equipment—EUV steppers, plasma etchers, CMP tools—and normalize it into a single API layer. You control the data pipeline. Our foundation models parse chamber logs, wafer event traces, and FOUP transfer data without requiring vendor-specific parsers.
The architecture is headless. Your team builds the remote session UI that fits your workflow, while the AI layer handles root cause correlation, pattern matching across historical incidents, and automated session documentation. No lock-in: APIs expose raw telemetry, parsed insights, and suggested resolutions as JSON. You own the integration.
Semiconductor equipment generates 2-5 TB of telemetry per tool per day—SECS/GEM messages, EDA traces, chamber sensor streams. The platform's ingestion layer handles this volume via streaming APIs that connect directly to tool controllers or SECS message brokers. You define which parameters matter: temperature excursions in plasma chambers, pressure drift in CVD tools, alignment errors in lithography steppers.
The AI layer learns fab-specific baselines. It distinguishes normal recipe variation from contamination events, correlates wafer-level defects with upstream process drift, and flags anomalies before they cascade into yield loss. Integration patterns use existing MES hooks—no rip-and-replace of equipment control infrastructure.
The platform uses foundation models trained on telemetry structure, not content. When you ingest a new log format, the AI identifies field delimiters, timestamp conventions, and parameter hierarchies through pattern recognition. You map critical parameters once via API; the model infers schema for the rest.
All parsed telemetry and insights export as JSON via REST APIs. Your code calls Bruviti endpoints the same way it would call any other API. If you migrate, your integration layer stays intact—you swap the backend without rewriting client code. We don't control your data pipeline or UI.
Yes. The SDK exposes a workflow builder that maps equipment states to resolution steps. Your team defines decision trees for lithography vs. etch vs. metrology tools. The AI suggests next steps based on telemetry, but engineers override or extend workflows via Python scripts that run in your environment.
The foundation model pre-trains on cross-industry equipment patterns, then fine-tunes on your fab's telemetry during a calibration phase. You control the training data scope—single tool, tool family, or entire fab. The API returns confidence scores per prediction so engineers know when the model is extrapolating beyond its training set.
Streaming analysis latency averages 200-800ms from telemetry ingestion to root cause suggestion, depending on log complexity. For batch analysis of historical data, you control parallelization via API parameters. The platform auto-scales compute for large telemetry volumes without manual tuning.

Software stocks lost nearly $1 trillion in value despite strong quarters. AI represents a paradigm shift, not an incremental software improvement.
Function-scoped AI improves local efficiency but workflow-native AI changes cost-to-serve. The P&L impact lives in the workflow itself.

Five key shifts from deploying nearly 100 enterprise AI workflow solutions and the GTM changes required to win in 2026.
See how Bruviti's APIs integrate with your existing tools and telemetry infrastructure.
Talk to an Engineer