Decades-old equipment lifecycles demand inventory precision—excess stock erodes margin, stockouts halt customer production.
Bruviti deployment data shows a global industrial manufacturer realized $2M in annual savings and a 25% first-time fix rate gain from AI parts intelligence. The savings come from fewer expedited shipments, leaner safety stock, and parts arriving with the technician. Executives get a hard ROI line, not a soft efficiency claim.
Industrial OEMs carry 10-30 year parts obligations for machinery in remote locations. Legacy forecasting methods overstock slow-movers while missing fast-moving failures, tying up capital in parts that sit unused.
Missing critical spare parts for heavy machinery, CNC machines, or turbines means customer production halts. Each day of downtime damages OEM reputation and triggers SLA penalties, directly impacting margin.
When demand forecasting fails and stockouts occur, industrial OEMs resort to expedited air freight for heavy components. These unplanned logistics costs devastate service margin on already-thin aftermarket revenue.
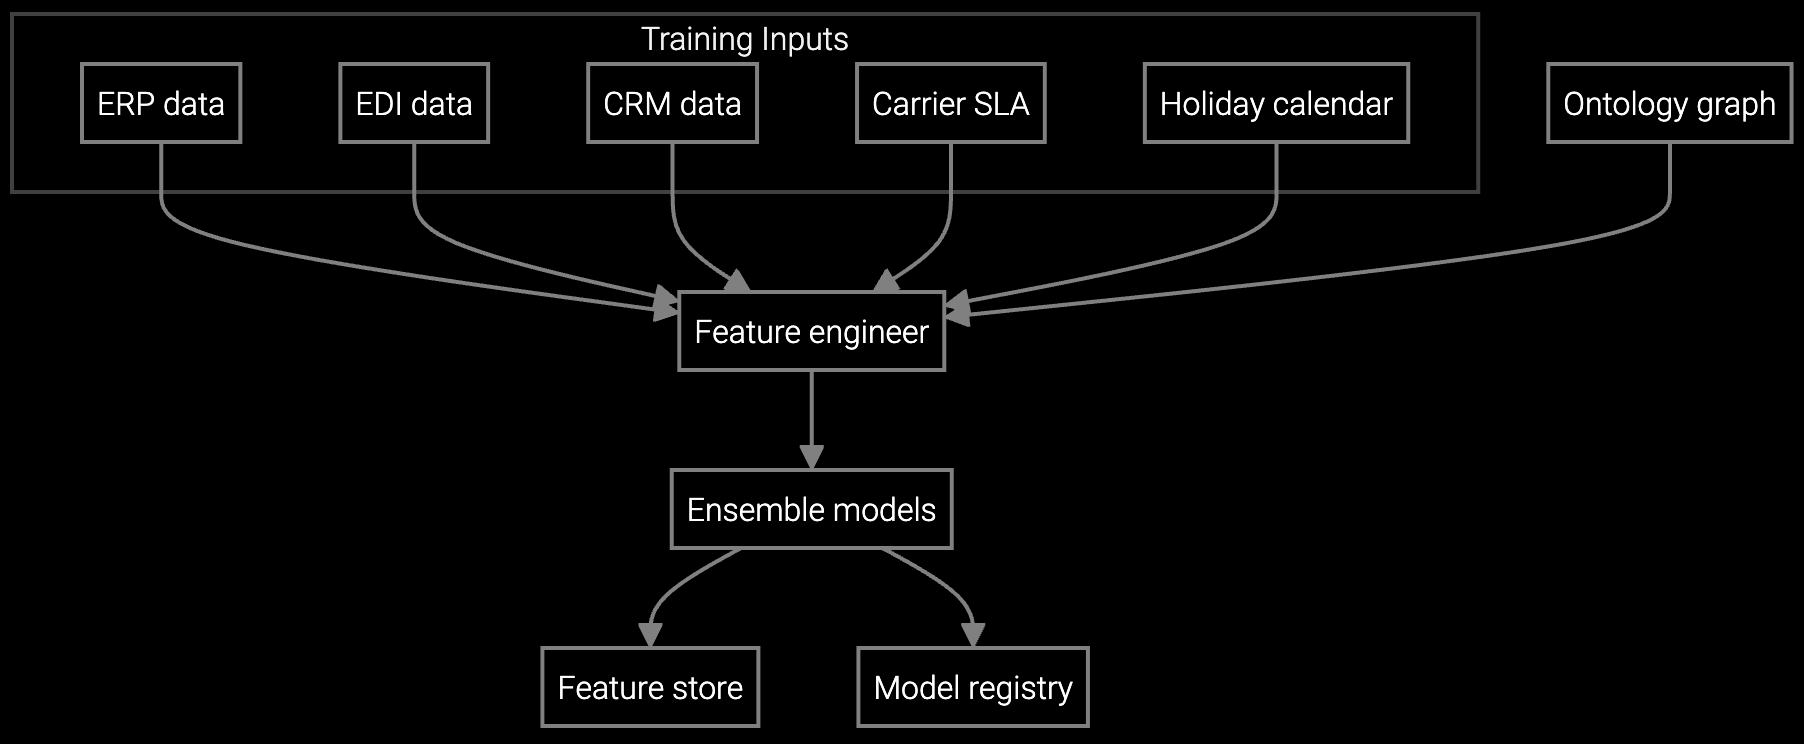
Bruviti's platform ingests decades of service history, sensor telemetry from PLCs and SCADA systems, and installed base configuration data to predict parts demand with precision unattainable through manual methods. The AI identifies failure patterns across equipment vintages, geographic conditions, and operating profiles—forecasting which parts will be needed, where, and when.
This predictive accuracy transforms inventory from a reactive cost center into a strategic margin protector. The platform optimizes stock levels across multi-location warehouse networks, suggests substitute parts for obsolete components, and triggers automated replenishment only when demand models justify it. The result: lower carrying costs, higher fill rates, and elimination of emergency shipping expenses that erode service profitability.
Forecasts demand for industrial machinery parts by location and time window, optimizing stock levels while reducing carrying costs for decades-old equipment lines.
Projects parts consumption for heavy machinery and automation equipment based on installed base age, run hours, and seasonal usage patterns.
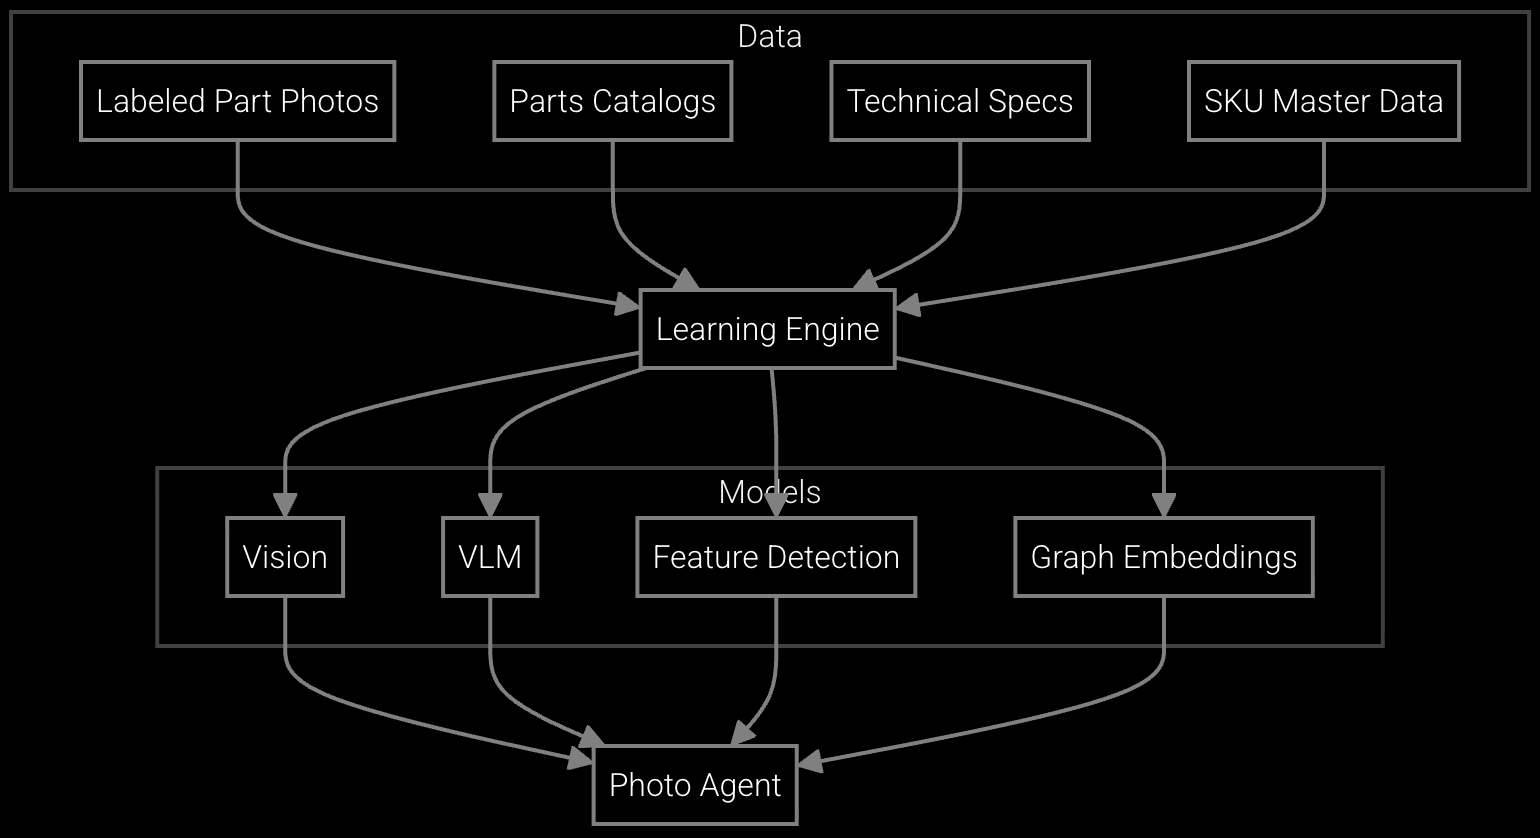
Snap a photo of a pump, compressor, or CNC component and get instant part number identification and availability across your warehouse network.
Industrial equipment manufacturers support machinery for 10-30 years, often serving customers in remote mining, manufacturing, or power generation sites. A CNC machine sold in 1998 still requires bearing replacements. A turbine installed in 2005 needs seal kits. Legacy ERP systems forecast demand using simple moving averages that ignore equipment age, operating conditions, and failure pattern evolution.
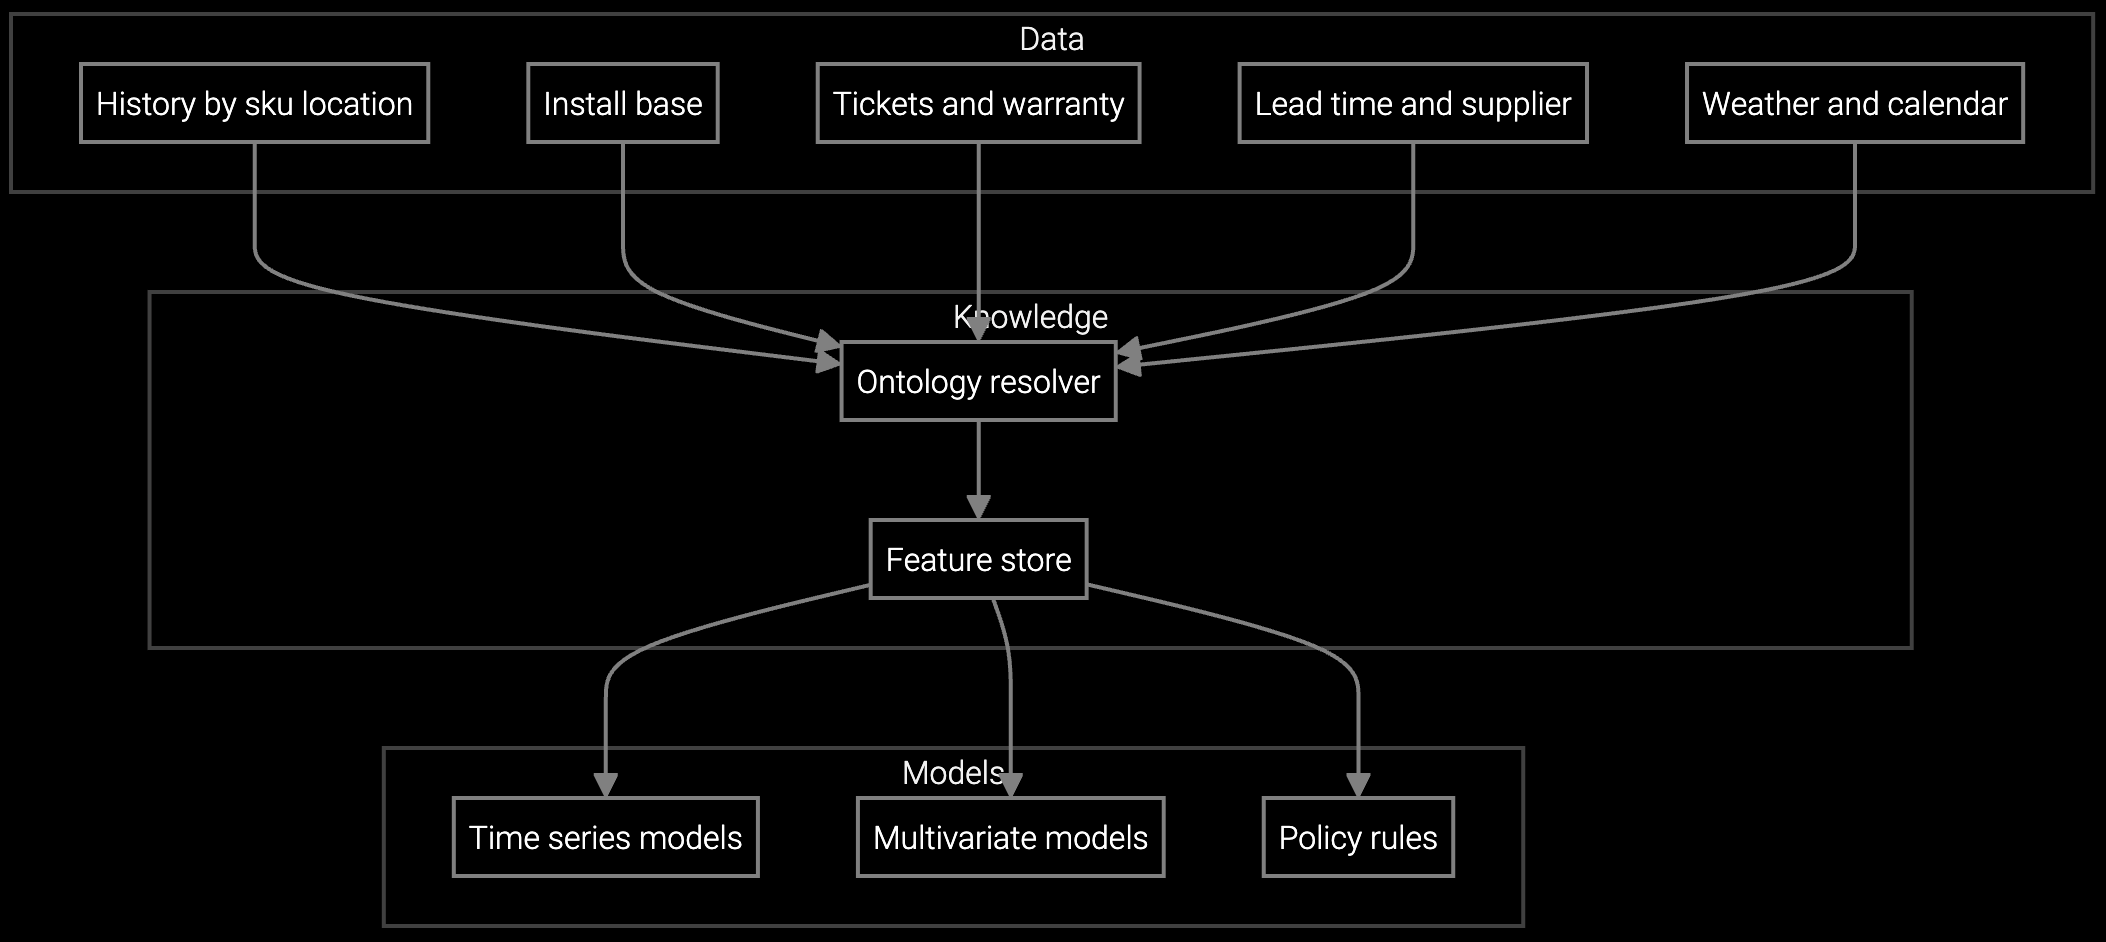
The AI learns from decades of service records, correlating part failures with equipment run hours, vibration signatures, temperature excursions, and maintenance history. It recognizes that compressors in coastal environments corrode faster, that older CNC spindles fail predictably at certain cycle counts, and that seasonal production spikes in certain industries drive parts demand. This contextual forecasting accuracy is what unlocks the 18-25% carrying cost reduction—by stocking precisely what will be needed, not what was needed on average five years ago.
Carrying cost includes warehousing, insurance, obsolescence risk, and capital opportunity cost—typically 22-30% of inventory value annually for industrial OEMs. AI demand forecasting reduces excess stock by 60-80% on slow-moving SKUs while maintaining fill rates, directly reducing total inventory value and therefore total carrying cost. The savings range reflects differences in current inventory efficiency and warehouse network complexity.
Track three board-ready metrics: total inventory value as percentage of revenue, fill rate percentage, and emergency shipment expenses as percentage of service revenue. Industrial OEMs typically see inventory value drop 18-25%, fill rate improve from 78-85% to 92-97%, and emergency shipment costs fall 60-75% within 9-12 months. These translate directly to margin improvement and cash flow release.
The platform identifies substitute parts by analyzing engineering specifications, historical usage patterns, and cross-compatibility data from service records. When an OEM discontinues a bearing or seal kit, the AI recommends compatible alternatives from current product lines or third-party suppliers, maintaining parts availability without holding obsolete stock indefinitely.
Most industrial equipment manufacturers achieve positive ROI within 9-14 months. The largest savings come from eliminating emergency air freight for heavy components and releasing capital from slow-moving inventory. For a $50M annual service revenue OEM carrying $12M in parts inventory, a 20% carrying cost reduction releases $2.4M annually while improving customer uptime.
Bruviti ingests inventory levels across all warehouse locations and forecasts demand by geographic region based on installed base density and service history. The AI recommends optimal stock allocation across the network, triggers inter-warehouse transfers when regional demand spikes, and suggests regional consolidation opportunities for slow-moving SKUs to reduce total carrying cost.

SPM systems optimize supply response but miss demand signals outside their inputs. An AI operating layer makes the full picture visible and actionable.
Advanced techniques for accurate parts forecasting.

AI-driven spare parts optimization for field service.
See how Bruviti's AI optimizes parts inventory to protect margin and improve customer uptime.
Schedule ROI Analysis