Carrying costs consume 18-25% of appliance parts value annually while stockouts delay service and erode customer satisfaction.
Bruviti deployment data reports a 30% reduction in expedite costs and 95% delivery date accuracy after AI parts forecasting. For appliance manufacturers, the savings come from killing rush freight and overnight shipping that static planning forces, while reliable arrival dates let service schedule around confirmed parts instead of guesses.
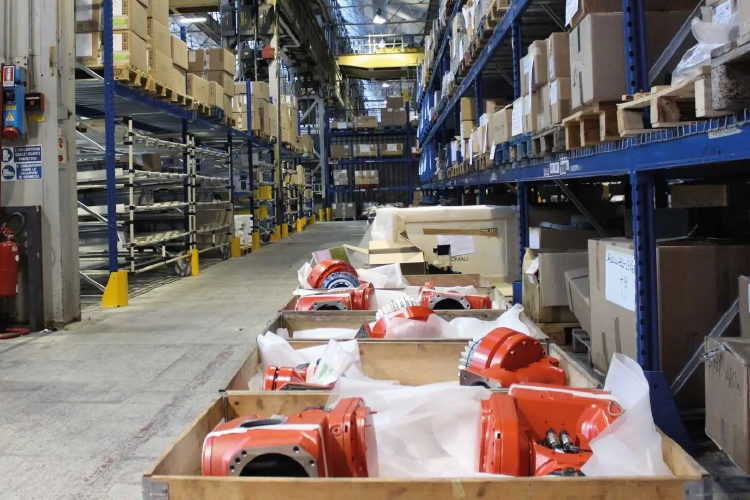
Appliance manufacturers stock decades of legacy parts for discontinued models, tying up capital in slow-moving inventory. Safety stock buffers compound across hundreds of SKUs and multiple warehouse locations.
Stockouts force expensive overnight shipping to meet same-day service commitments. Each rush shipment erodes margin and signals forecasting failure that repeats seasonally.
Technology transitions and product refreshes strand inventory. HVAC control boards and refrigerator electronics become unsellable when new generations launch, generating write-offs that impact quarterly margins.
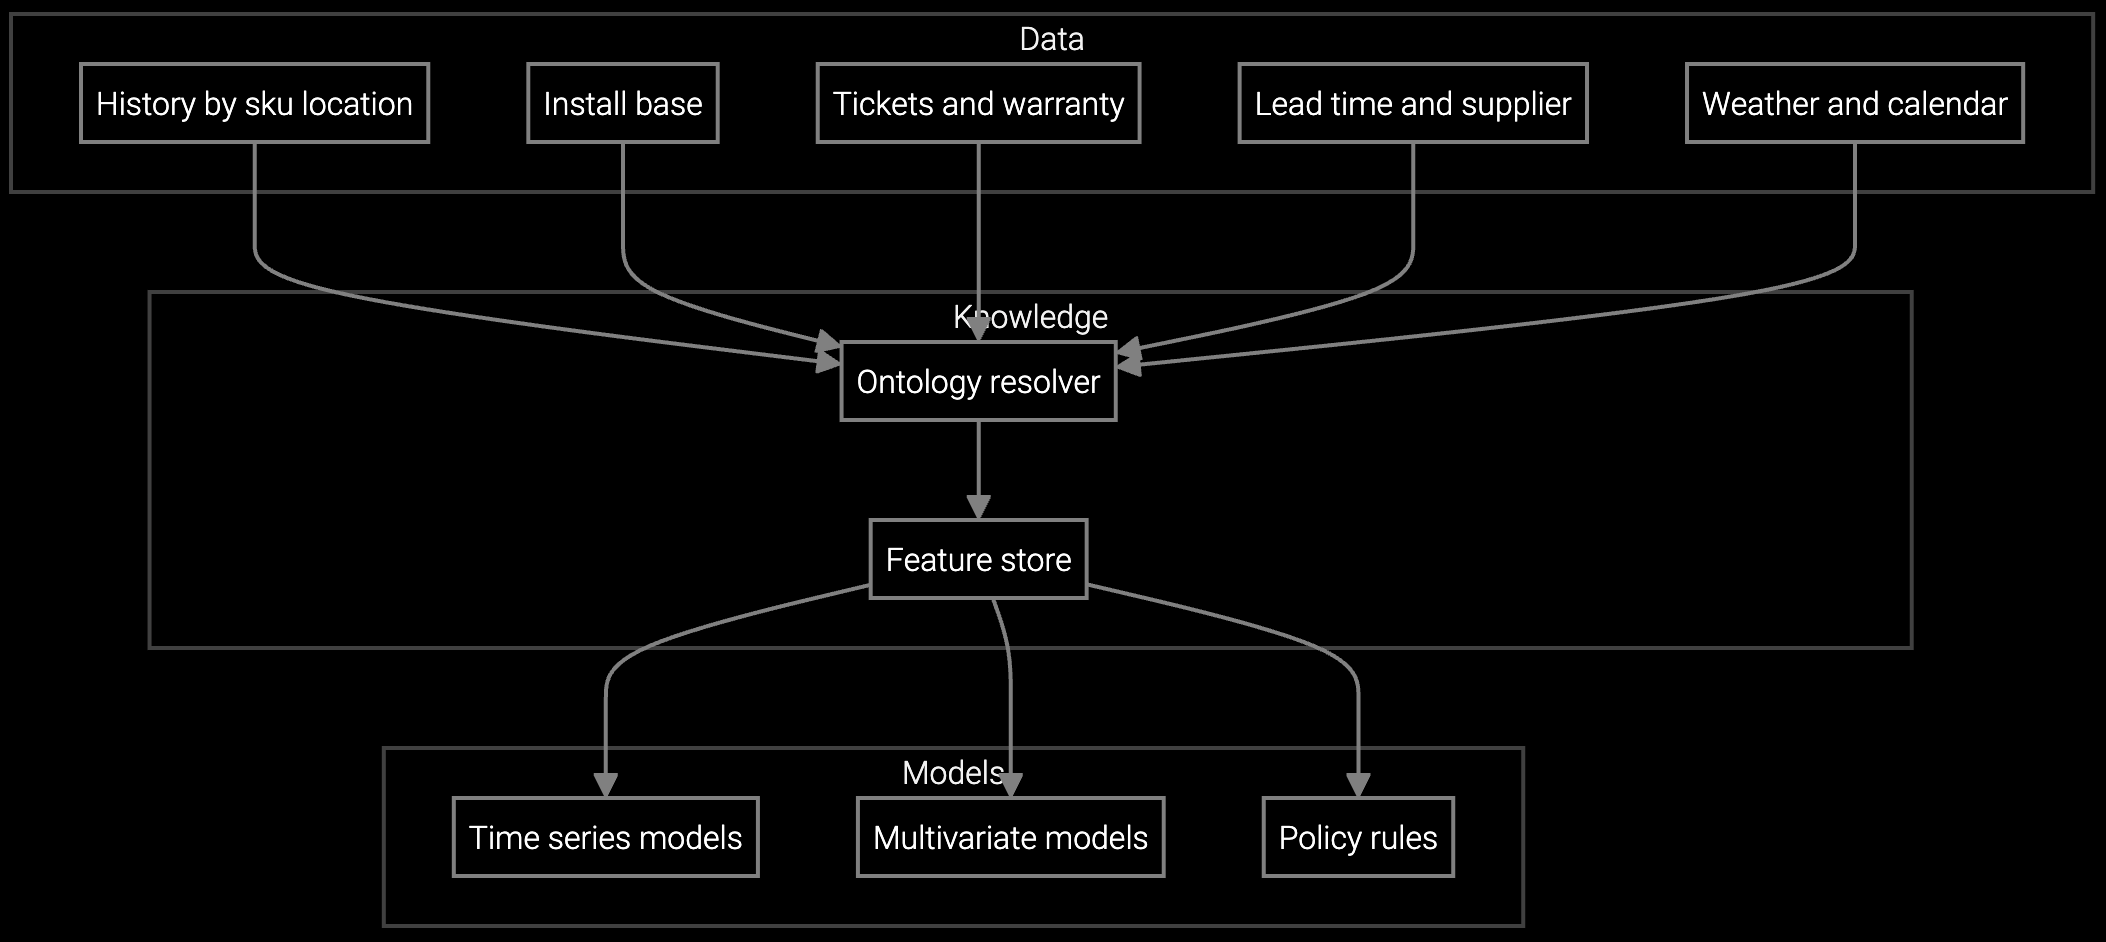
Bruviti's platform applies machine learning to decades of service history, installed base telemetry, and seasonal patterns to optimize parts positioning and reduce waste. The system forecasts demand at the SKU-location-week level, adjusting dynamically as warranty claims and repair trends shift.
For appliance OEMs managing thousands of parts across refrigeration, HVAC, and kitchen equipment, the platform identifies slow-moving inventory eligible for consolidation, flags emerging demand spikes before stockouts occur, and recommends substitute parts when exact matches face lead time delays. This precision reduces both carrying costs and expedited freight while maintaining service SLAs.
Projects refrigerator compressor and HVAC component consumption based on installed base age, seasonal usage patterns, and historical failure curves.
Optimizes dishwasher pump and water heater element stock levels by location and time window, reducing carrying costs while improving availability.
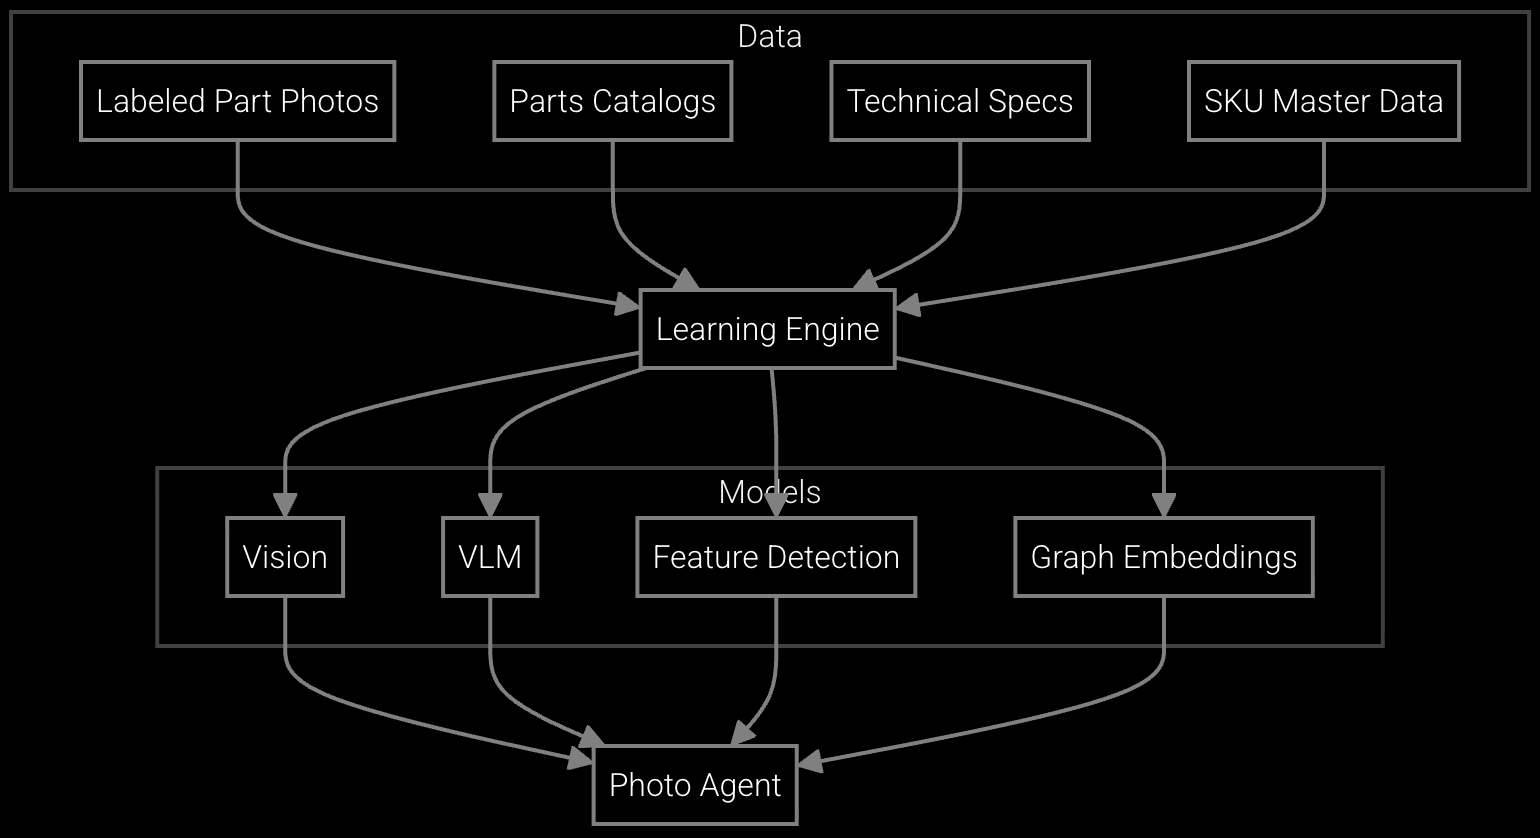
Identifies appliance components from customer photos to accelerate order accuracy and reduce returns from incorrect part shipments.
Appliance manufacturers operate on thin margins where inventory efficiency directly impacts profitability. Product lines spanning refrigerators, washers, HVAC systems, and kitchen equipment each carry hundreds of SKUs with highly seasonal demand—air conditioner parts spike in summer, furnace components in winter. This variability creates chronic overstocking of some items and stockouts of others.
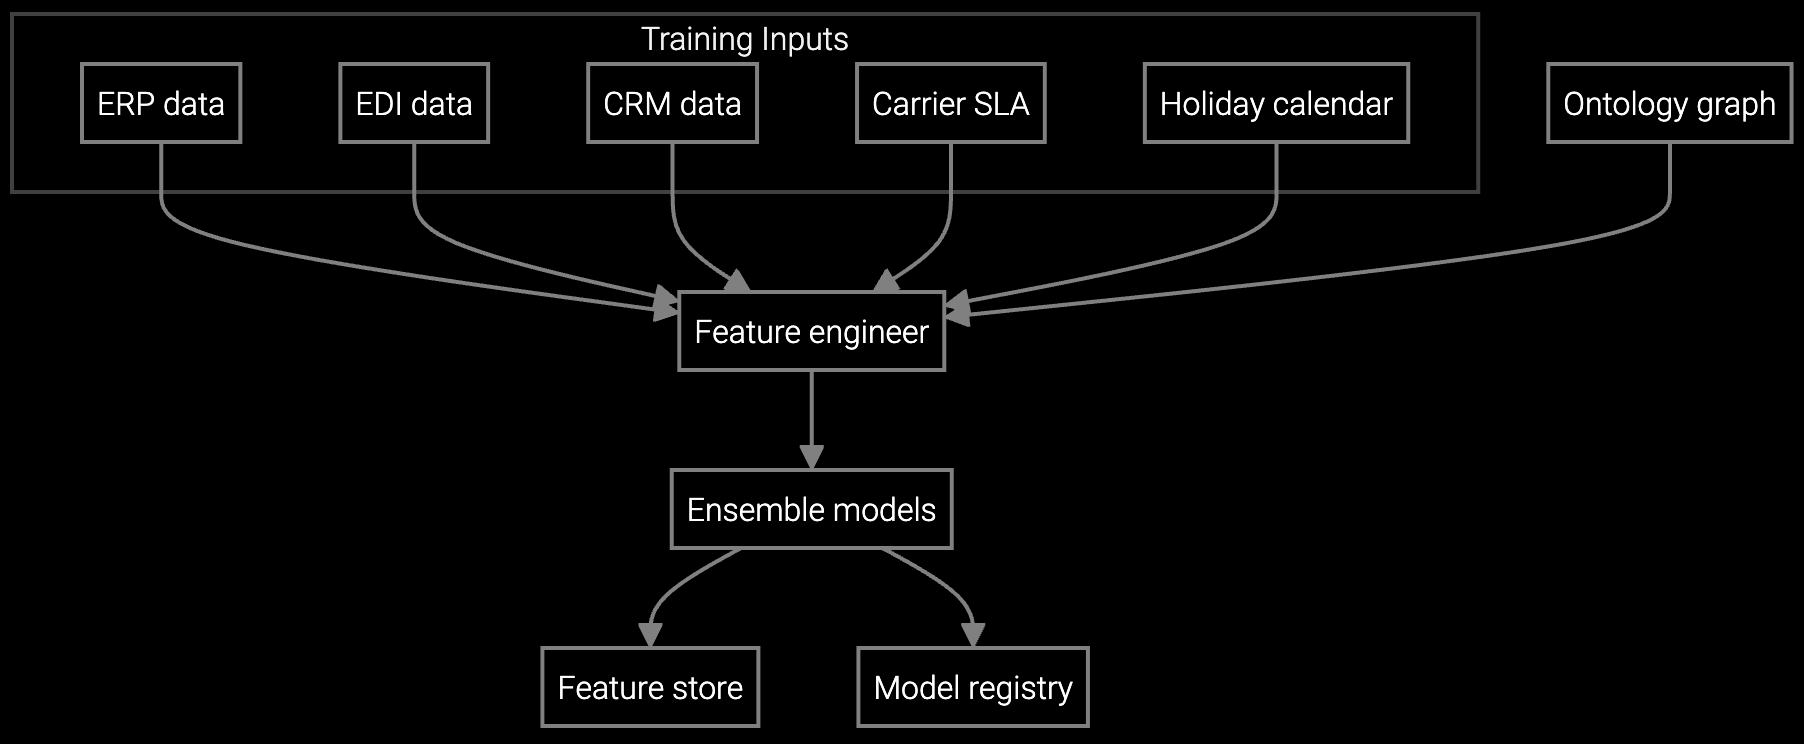
AI forecasting absorbs decades of warranty claims, service call records, and installed base age profiles to predict demand at granular levels. For a refrigerator compressor with 8-year typical life, the model adjusts forecasts as installation cohorts age into failure windows. This precision eliminates the safety stock padding that currently inflates carrying costs while maintaining service readiness during peak seasons.
Most appliance manufacturers see positive ROI within 6-9 months. Early savings come from reduced emergency shipping and lower safety stock buffers. Long-term gains compound as forecast accuracy improves and obsolescence write-offs decline. Mid-size manufacturers typically save $1.8-3.2M annually in carrying costs and expedited freight.
Carrying cost includes warehousing (30%), capital cost (25%), obsolescence risk (20%), insurance (10%), and handling (15%). For appliance parts averaging 22% annual carrying cost, reducing inventory by $10M saves $2.2M yearly. The platform tracks on-hand value weekly and compares against baseline to quantify savings.
The system requires 2-3 years of service order history with part numbers, quantities, and dates. Installed base data (model, serial, install date) improves accuracy by aligning forecasts with aging cohorts. Warranty claims and seasonal patterns enhance predictions for refrigeration and HVAC components with weather-driven failure modes.
The platform identifies seasonal patterns in historical data and adjusts forecasts based on regional weather trends. For air conditioner components, it anticipates summer spikes 8-12 weeks ahead, optimizing stock positioning before peak season. This eliminates the stockouts that currently force costly rush shipments during heat waves.
Track four board-level metrics monthly: inventory carrying cost as percentage of parts value (target 15-18%), fill rate (target 92%+), emergency shipment rate (target <3% of orders), and forecast accuracy (target 85%+). These directly tie to margin protection and service reliability, making the business case clear to CFOs and operations leaders.

SPM systems optimize supply response but miss demand signals outside their inputs. An AI operating layer makes the full picture visible and actionable.
Advanced techniques for accurate parts forecasting.
AI-driven spare parts optimization for field service.
See how AI-driven forecasting can reduce your carrying costs while maintaining service readiness.
Schedule ROI Analysis