Inventory carrying costs consume 22-28% of parts value annually while stockouts trigger SLA penalties—the ROI case demands precision.
AI parts prediction cuts parts returns 25% for network equipment service, per Bruviti deployment data, eliminating the over-ordering and wrong-part shipments that quietly inflate inventory cost. Combined with higher fill rates, the savings come from sending the right part the first time, reducing both returns processing and excess stock tied up in transit.
Safety stock buffers for routers, optical modules, and power supplies tie up working capital while firmware updates and product refreshes render parts obsolete before they're consumed.
Same-day air freight for critical switch components and fiber modules costs 8-12x standard shipping while stockouts trigger SLA penalties and customer escalations.
End-of-life transitions for security appliances and wireless controllers leave warehouses holding parts for discontinued models, forcing write-downs that directly impact gross margin.
Bruviti's platform ingests telemetry from network devices—SNMP traps, syslog streams, error counters, temperature sensors—and predicts component failures before they trigger customer-impacting outages. The financial impact flows through three mechanisms: demand forecasting that eliminates safety stock buffers, location optimization that positions inventory where failures will occur, and substitute matching that extends the useful life of existing stock.
The ROI calculation is straightforward. Carrying costs drop 18-24% as predictive demand replaces reactive buffering. Emergency shipments decline 40-55% when parts arrive at depots before failures occur. Obsolescence write-offs shrink 25-35% as substitute matching extends inventory turns. The net result is margin protection measured in basis points—critical when service already operates as a cost center.
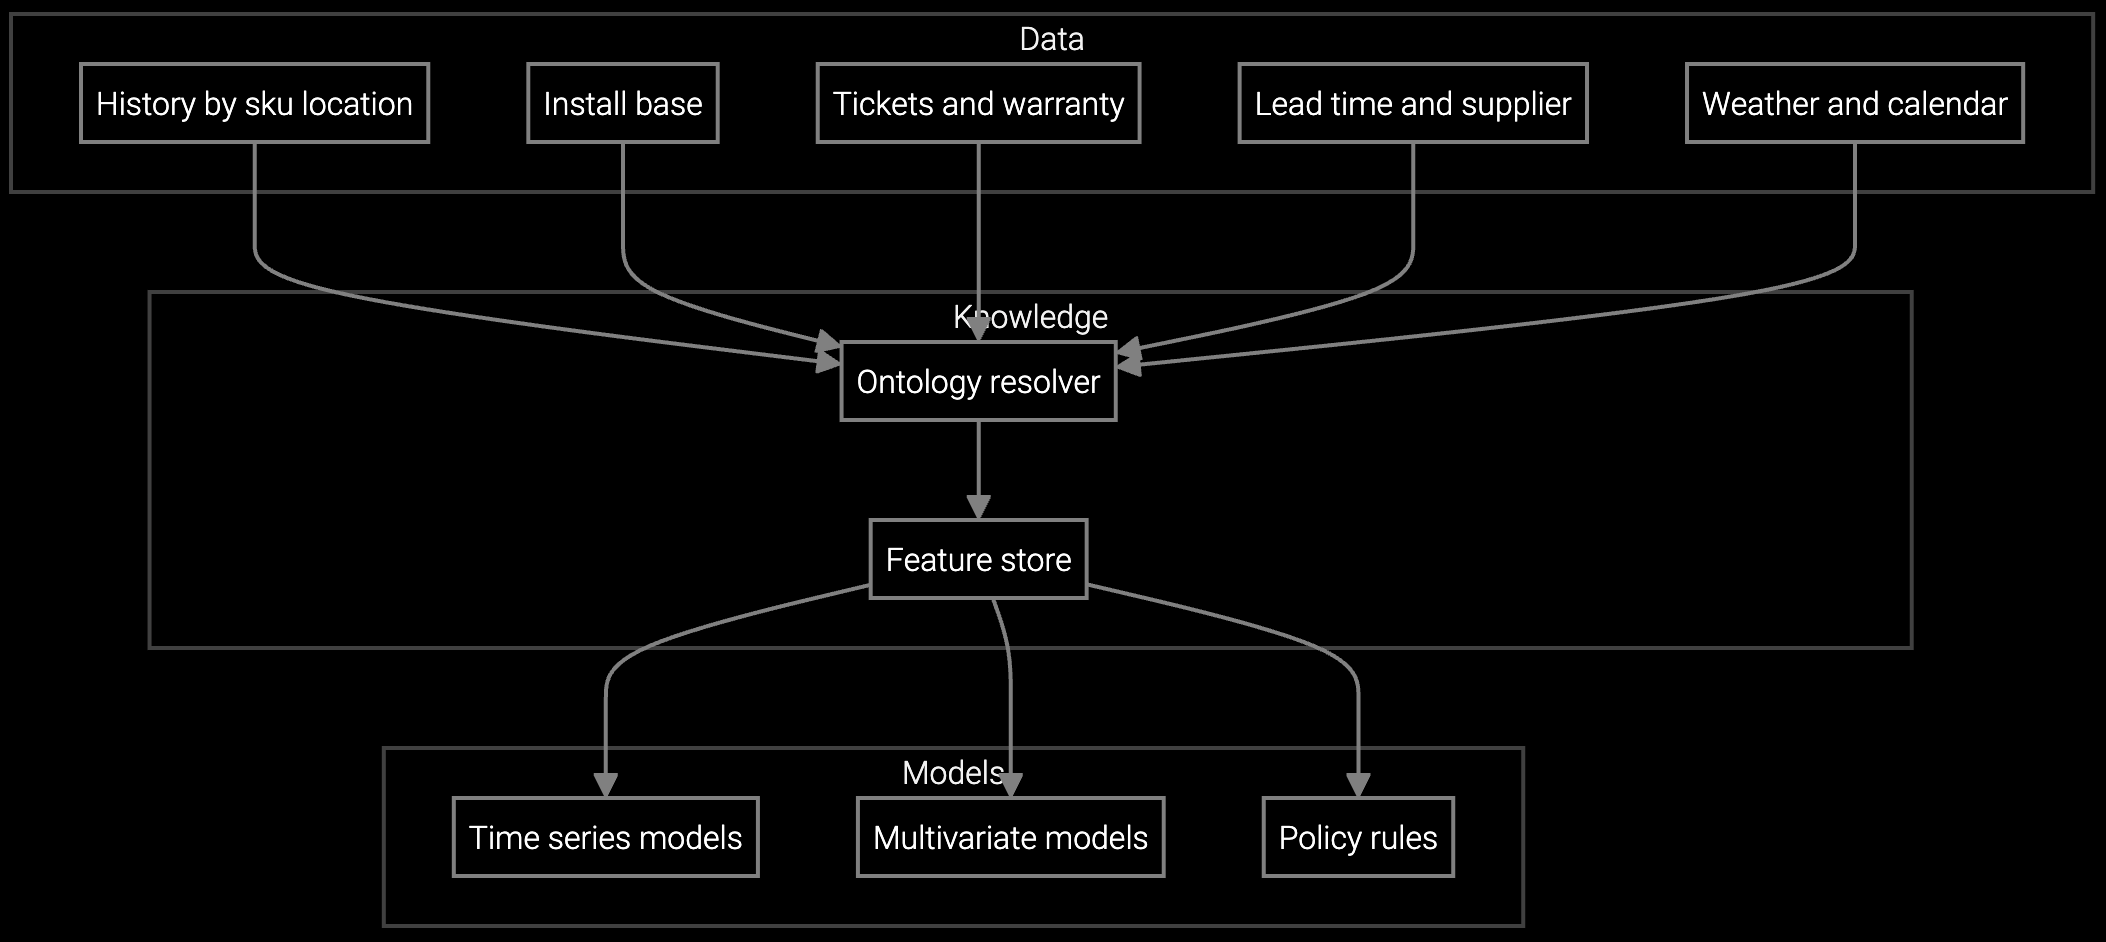
Projects router component and optical module consumption by analyzing installed base age, firmware telemetry, and seasonal traffic patterns to optimize stock levels across regional depots.
Forecasts parts demand by location and time window for network equipment, optimizing stock positioning to eliminate emergency shipments while maintaining 99.99% availability targets.
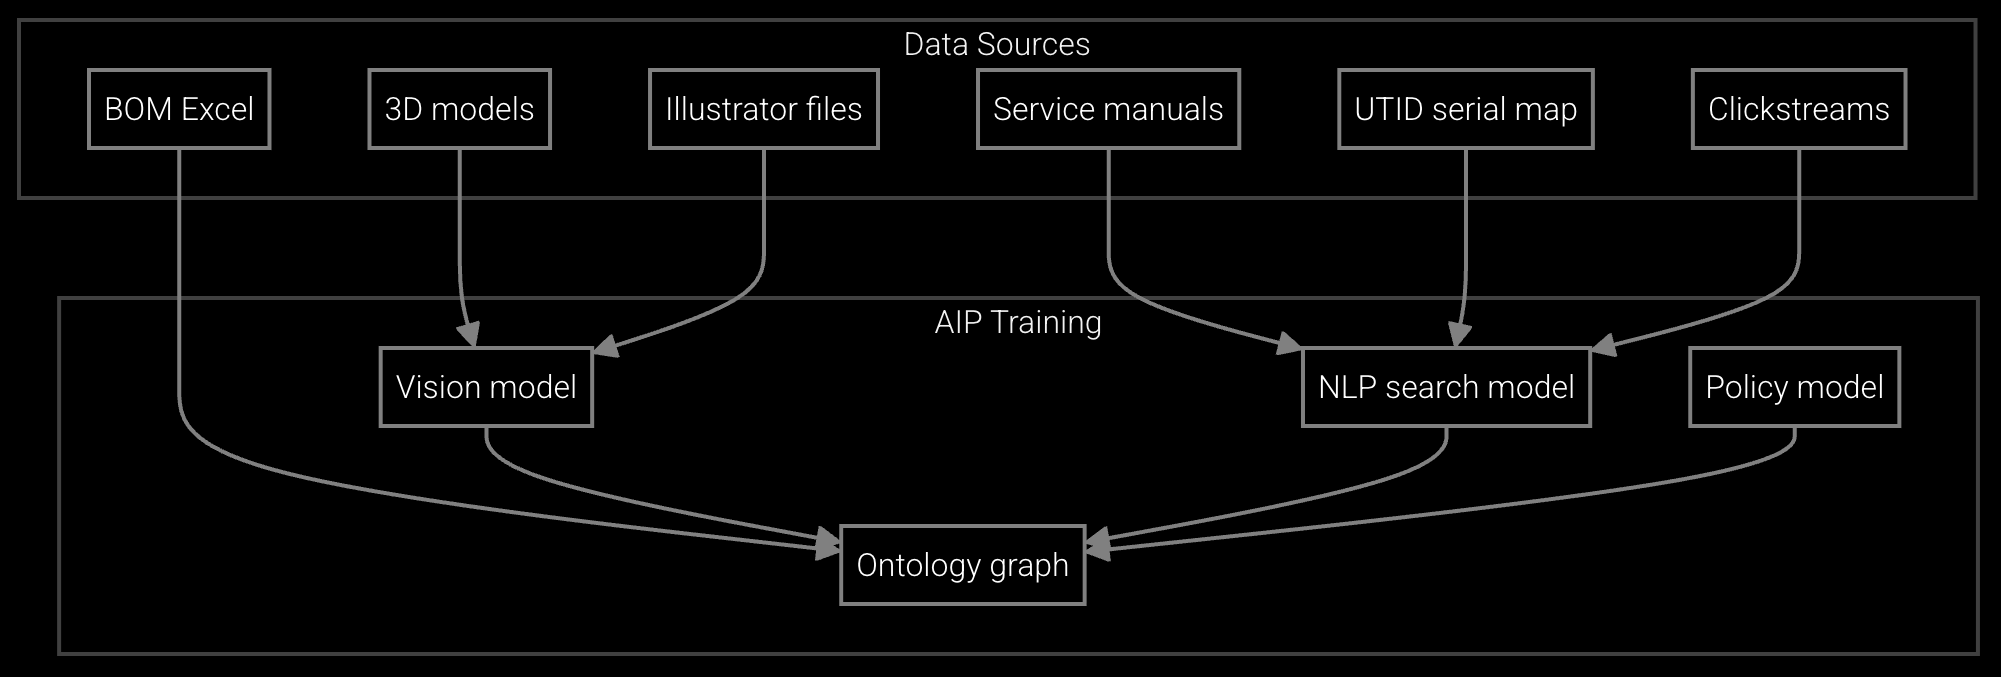
Automatically generates and maintains parts catalogs from engineering data and service records, identifying substitute components for end-of-life switches and security appliances to extend inventory turns.
Network infrastructure operates under 99.999% uptime requirements where every minute of downtime triggers SLA penalties and customer escalations. This drives safety stock buffers across thousands of SKUs—power supplies, line cards, optical modules, firmware-dependent components—each with unpredictable failure patterns influenced by traffic load, environmental conditions, and configuration complexity.
The financial pressure intensifies with product lifecycles. A carrier-grade router family spans 7-10 years while individual components see firmware updates quarterly and EOL transitions annually. Multi-vendor environments compound the problem as enterprises mix equipment across brands, forcing OEMs to stock parts for competitive devices to win service contracts. The result: inventory carrying costs that consume 24-32% of parts value annually while stockouts still trigger emergency shipments.
Network equipment OEMs see 8-14 month payback periods as carrying cost reductions and emergency shipment elimination offset implementation costs. The ROI accelerates when pilots focus on high-value product families with established telemetry infrastructure.
Calculate carrying costs as the sum of warehouse storage, capital cost of inventory, insurance, obsolescence risk, and handling labor—typically 24-32% of total inventory value annually. Track quarterly inventory turns and dollar value on hand by product family to measure improvement.
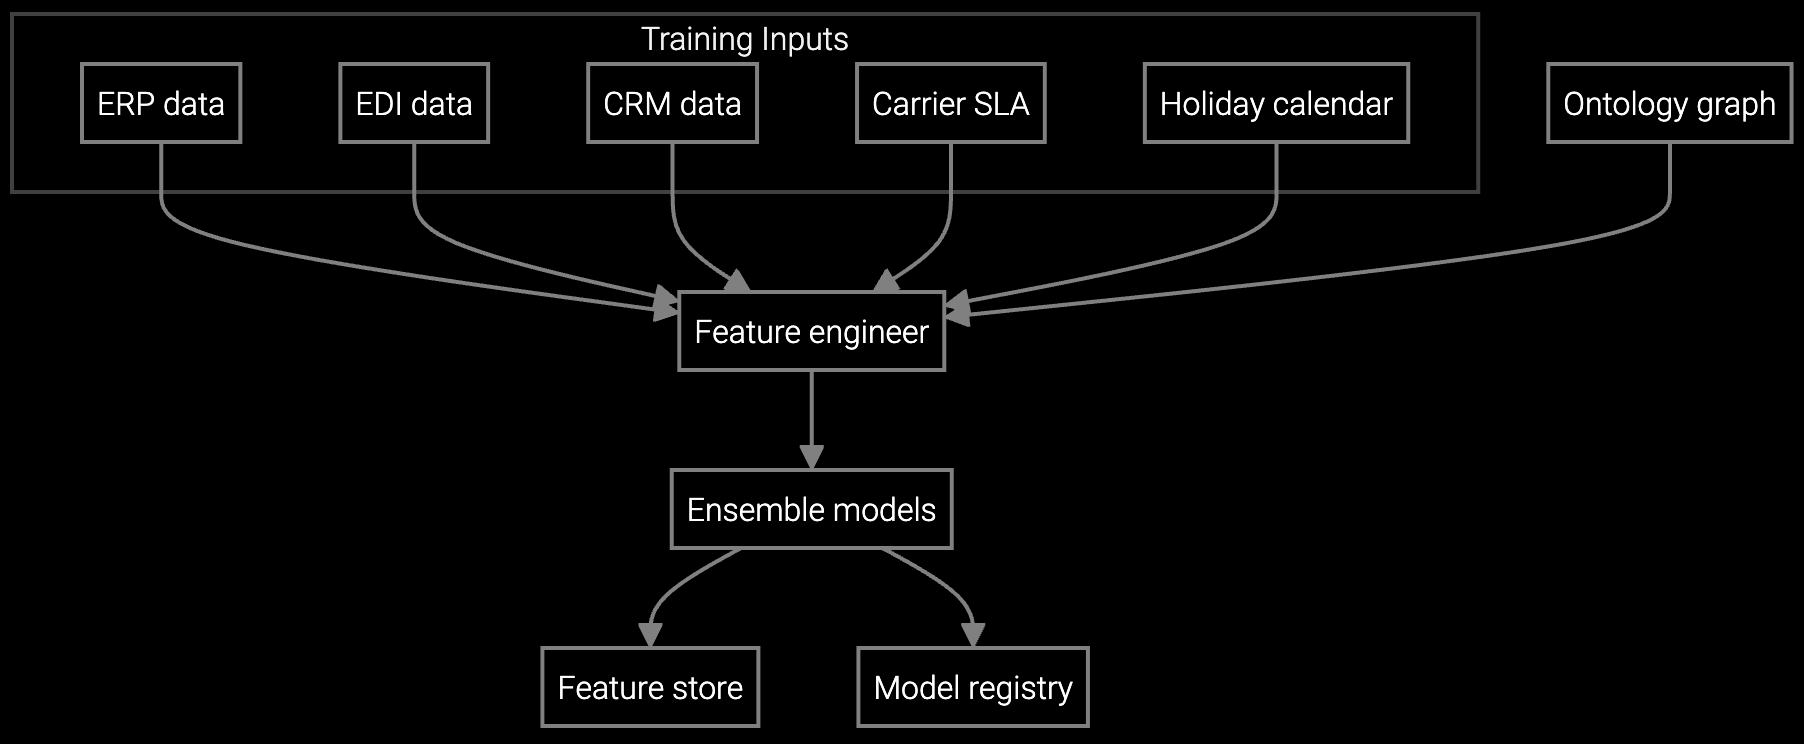
Effective demand forecasting requires device telemetry (SNMP traps, syslog, error counters), installed base data (serial numbers, firmware versions, deployment dates), historical failure records, and parts consumption patterns. Most network OEMs already collect this data through NOC monitoring systems.
Availability rates improve 2-4 percentage points as predictive positioning ensures parts arrive at depots before failures occur. This is particularly valuable for network equipment where 99.99% uptime requirements make every stockout a contract risk and customer escalation.
Network OEMs eliminate 40-55% of emergency shipments as failure prediction enables proactive parts positioning. The reduction is highest for predictable failure modes like power supply degradation and environmental stress, and lower for random failures from firmware bugs or configuration errors.

SPM systems optimize supply response but miss demand signals outside their inputs. An AI operating layer makes the full picture visible and actionable.
Advanced techniques for accurate parts forecasting.

AI-driven spare parts optimization for field service.
See how Bruviti's platform turns inventory from cost center to competitive advantage for network equipment OEMs.
Schedule ROI Discussion