Every hour of fab downtime costs over $1M—yet excess inventory ties up millions more in carrying costs.
AI parts inventory in semiconductor manufacturing cuts stockouts by 40% or more while holding a 95-98%+ fill rate, per Bruviti deployment data. For operators that means fewer emergency orders, less expedite freight, and lower safety stock, all from sharper per-SKU demand forecasts rather than blanket buffer increases.
When a $15M lithography tool goes down and the replacement chamber kit isn't in stock, every hour of delay cascades through the entire fab schedule. Emergency orders cost 3-5x standard pricing and still take days.
Fear of stockouts leads to over-ordering critical spares. Chamber components, consumables, and specialty parts accumulate across multiple fab sites with no visibility into what's actually needed versus what's sitting unused.
Process node transitions and tool upgrades render chamber kits and consumables obsolete faster than traditional depreciation cycles. Inventory systems lack predictive signals for which parts will become worthless in the next 12-18 months.
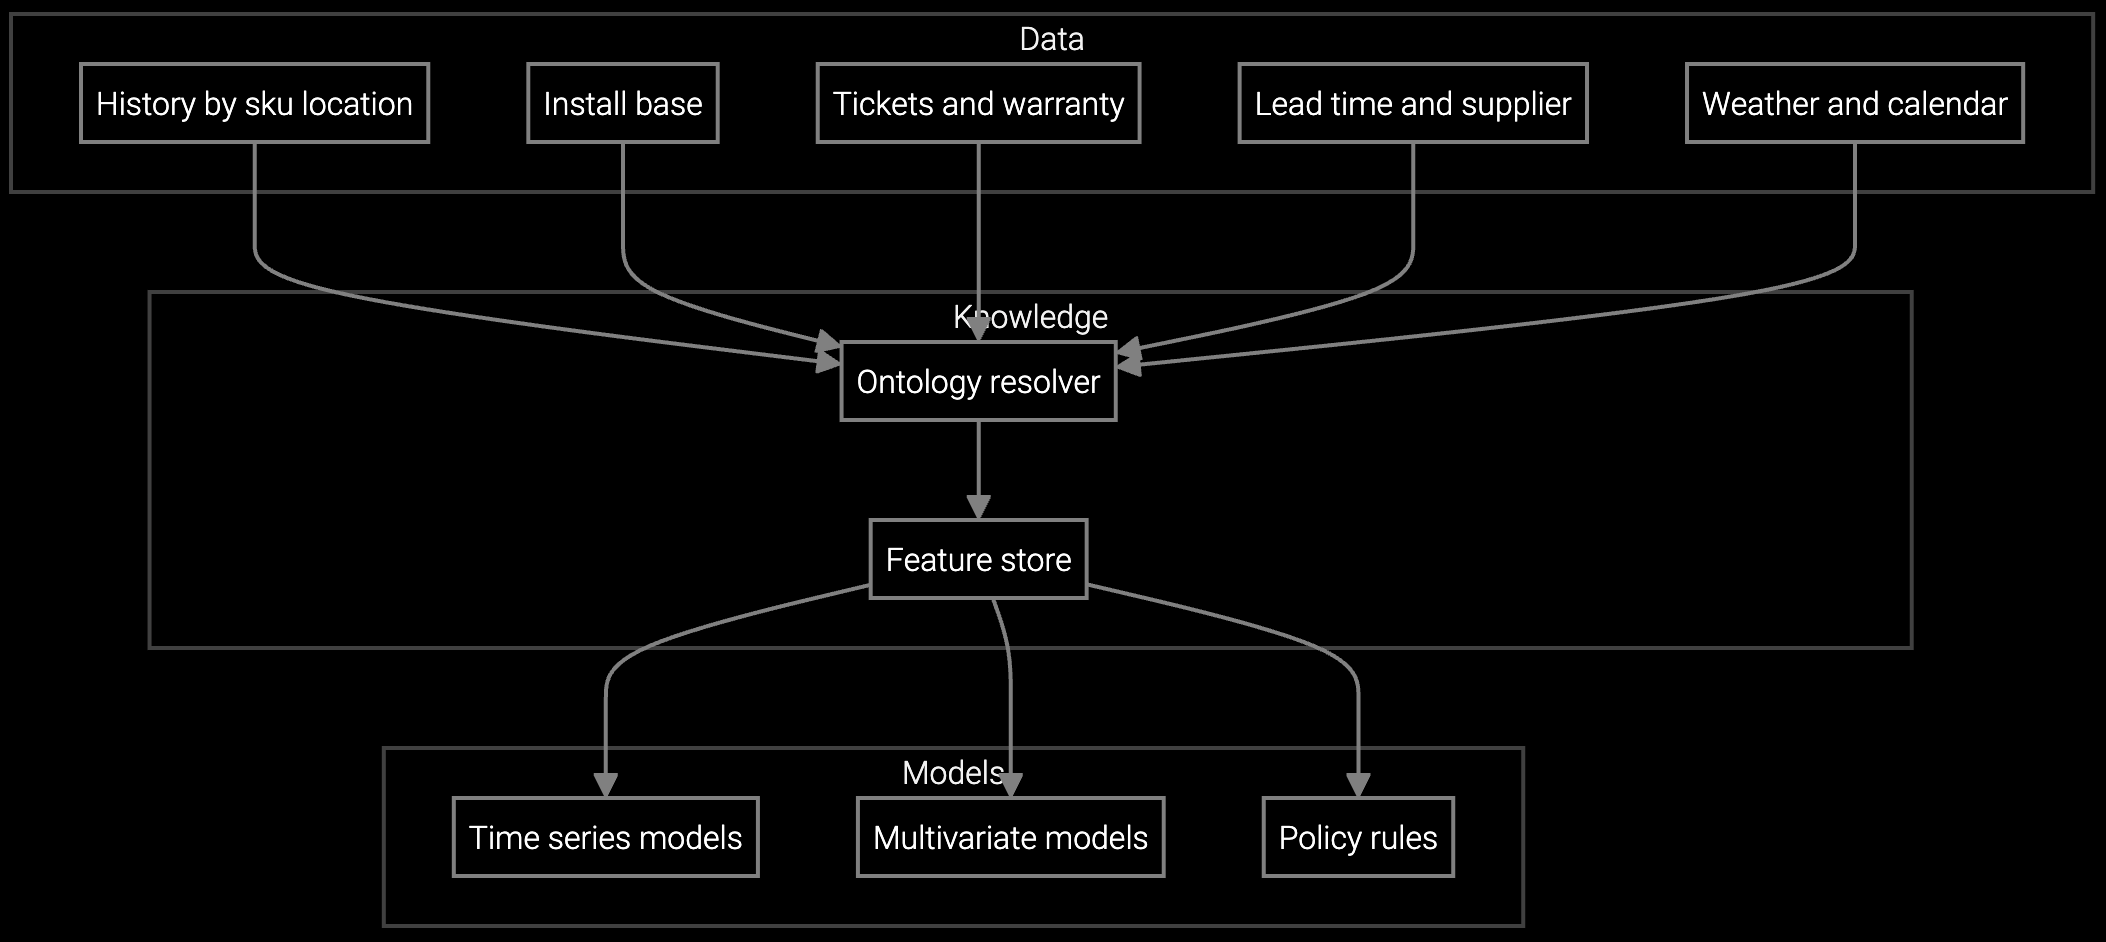
The platform ingests tool telemetry, PM schedules, process recipes, and historical consumption patterns to forecast parts demand by fab location and time window. Instead of guessing reorder points, the system calculates optimal stock levels that balance carrying costs against stockout risk for each chamber component, consumable, and critical spare.
When a preventive maintenance cycle approaches or sensor drift indicates chamber degradation, the platform automatically flags which consumables will be needed and where they should be staged. Automated reorder recommendations account for lead times, supplier reliability, and cross-fab transfer opportunities—eliminating manual spreadsheet reconciliation and reducing emergency expedites.
Projects chamber consumables and spares consumption based on installed tool age, PM schedules, and process recipe intensity across fab sites.
Forecasts parts demand by fab location and time window, optimizing stock levels to reduce carrying costs while maintaining fill rate targets.
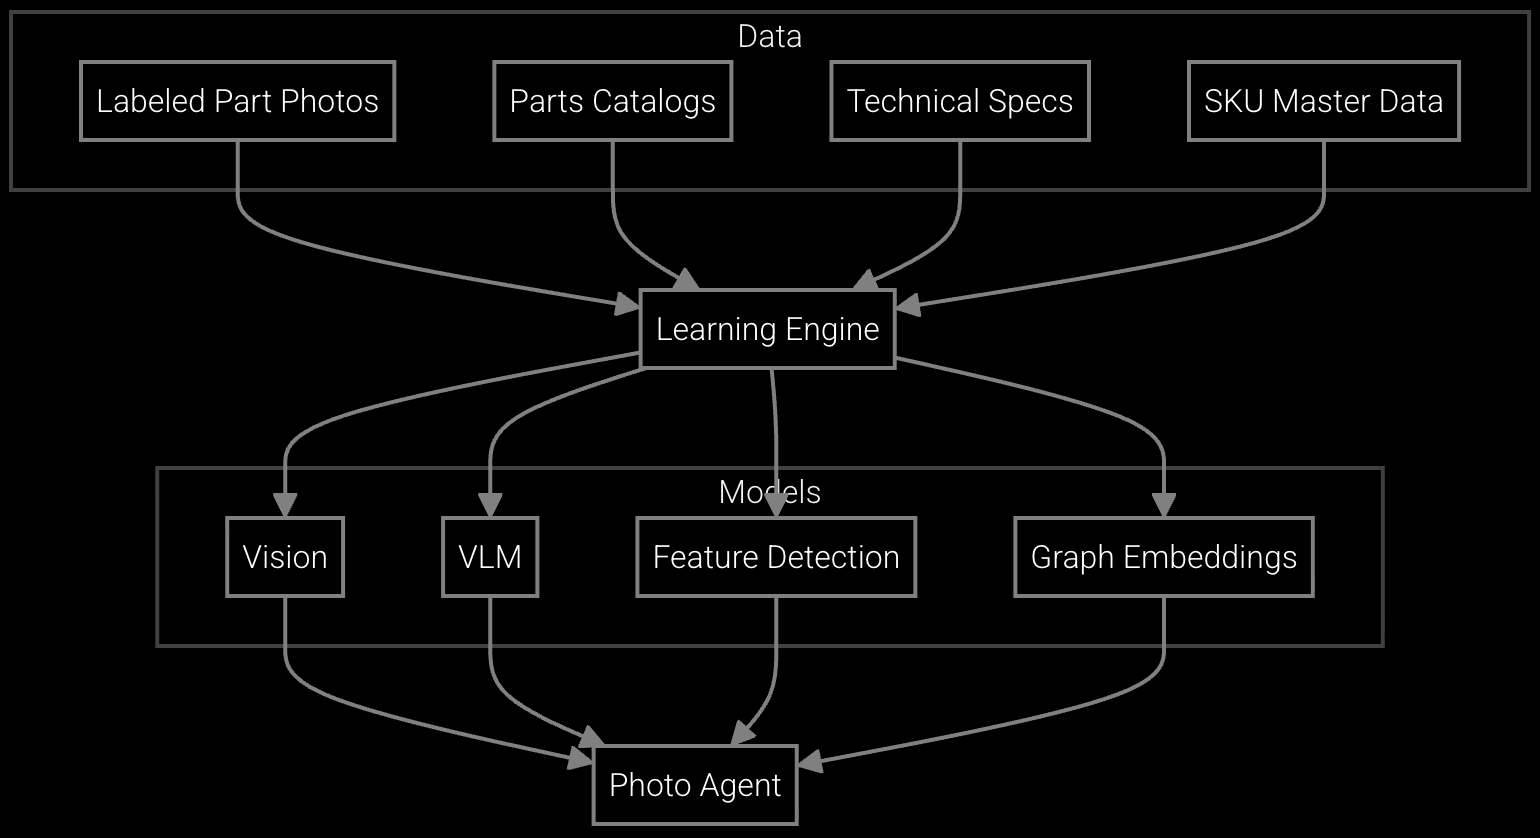
Snap a photo of a chamber component or consumable during PM and instantly retrieve part number, current inventory levels, and substitute options.
Semiconductor parts inventory operates under constraints that don't exist in other industries. Chamber component lifecycles correlate with wafer throughput and process recipe aggressiveness, not calendar time. A single etch tool may consume plasma source components at 3x the rate of an identical tool running different recipes. Lead times for specialty consumables can stretch 12-16 weeks, but process changes can render those parts obsolete before they arrive.
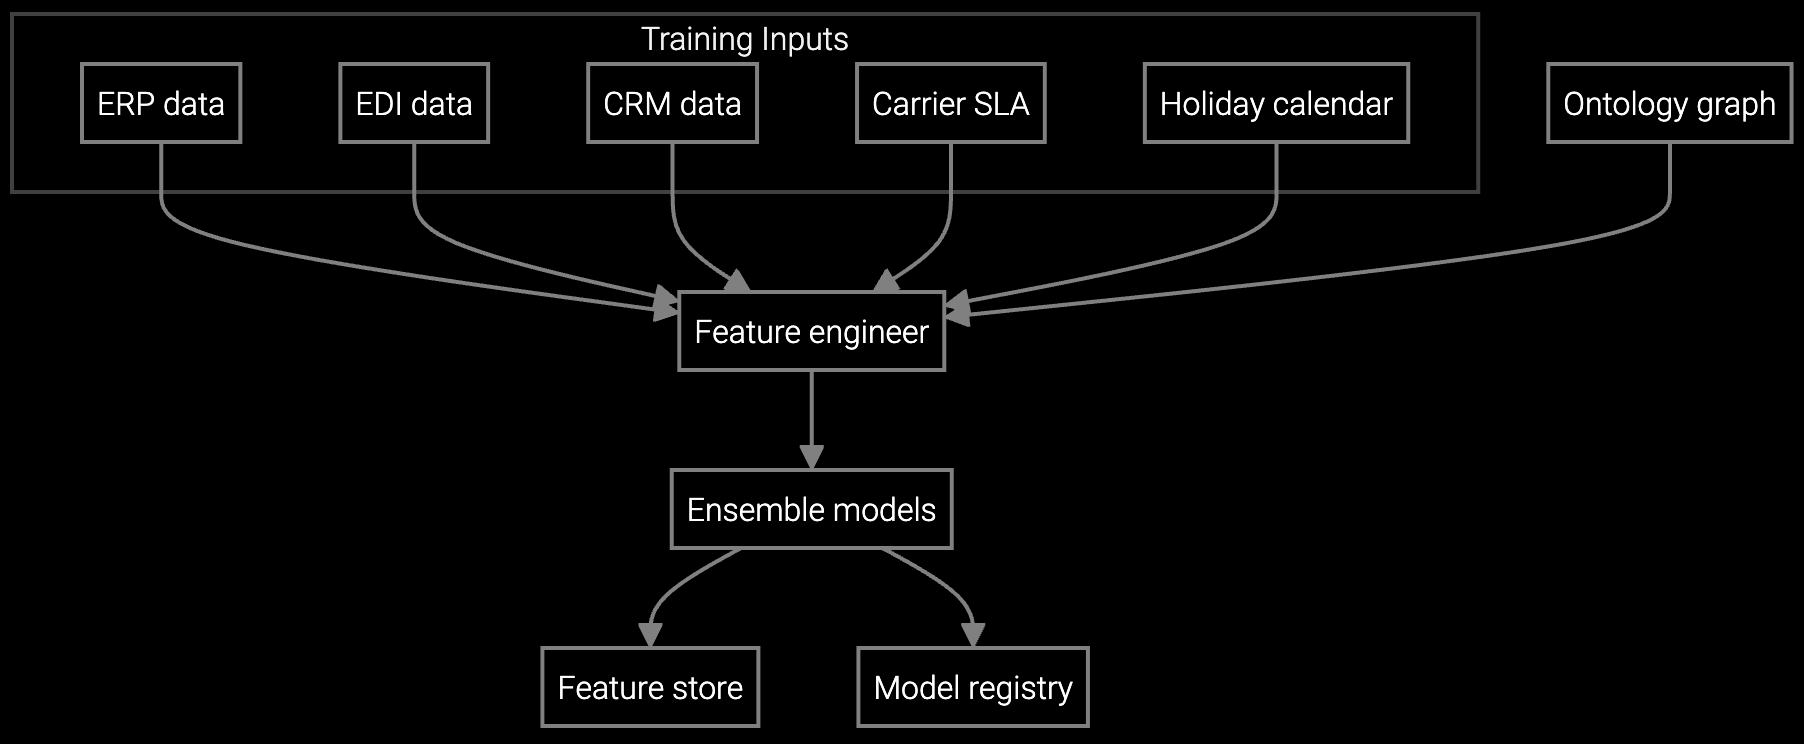
Traditional inventory systems track reorder points based on historical averages—useless in an environment where a single node transition can shift consumption patterns by 40%. The platform uses tool telemetry and recipe parameters to predict which chamber kits will degrade fastest, enabling proactive replenishment without over-stocking across the installed base.
Most semiconductor OEMs observe measurable improvements within 60-90 days of deployment. Initial gains come from reducing emergency expedite costs and avoiding stockouts for critical chamber components. Carrying cost reductions become visible in quarterly inventory valuations as the system rightsizes stock levels across fab locations.
Track fill rate for critical spares (target 95%+), emergency shipment frequency and cost, inventory turns by part category, and total carrying cost as a percentage of inventory value. Also measure reorder cycle time from demand signal to parts arrival, and obsolescence write-off rates for components affected by process node transitions.
The system correlates process recipe changes, tool upgrade schedules, and historical consumption patterns to identify which chamber components and consumables face obsolescence risk. It flags parts likely to become stranded inventory and recommends drawdown strategies, cross-fab transfers, or delayed reorders to minimize write-offs during transitions.
Yes. The platform maintains visibility into stock levels, consumption rates, and lead times across all fab locations. When one site faces a stockout, it automatically identifies transfer opportunities from other locations with excess inventory—avoiding emergency shipments while balancing carrying costs across the network.
Manual planning relies on historical averages that fail to account for tool-specific degradation rates, recipe intensity variations, or upcoming PM cycles. AI forecasting ingests real-time telemetry and correlates it with consumption patterns, producing location-specific predictions that adapt as process conditions change—reducing both stockouts and excess inventory.

SPM systems optimize supply response but miss demand signals outside their inputs. An AI operating layer makes the full picture visible and actionable.
Advanced techniques for accurate parts forecasting.

AI-driven spare parts optimization for field service.
Calculate your potential savings based on current fab inventory levels and stockout frequency.
Schedule ROI Analysis