With thousands of servers and components failing daily, excess inventory drains capital while stockouts break SLAs.
Bruviti deployment data shows AI parts prediction cuts parts returns by 25% while trimming pre-dispatch prep to under 2 minutes for data center operations. Technicians get the right parts the first time, so fewer get ordered, shipped, and sent back. Deployment data ties the savings to AI-generated picklists tuned to each job.
Overstocked drives, memory modules, and power supplies across multiple distribution centers tie up capital. You're paying insurance, warehouse space, and depreciation on parts that may obsolete before use.
Missing parts for failed server components force SLA breaches. Customers escalate when replacement drives or memory aren't available within committed windows, damaging OEM reputation.
Expedited shipping from distant warehouses or vendors costs 5-10x normal rates. Unpredictable failure patterns force reactive overnight shipments when predictive planning could avoid the premium.
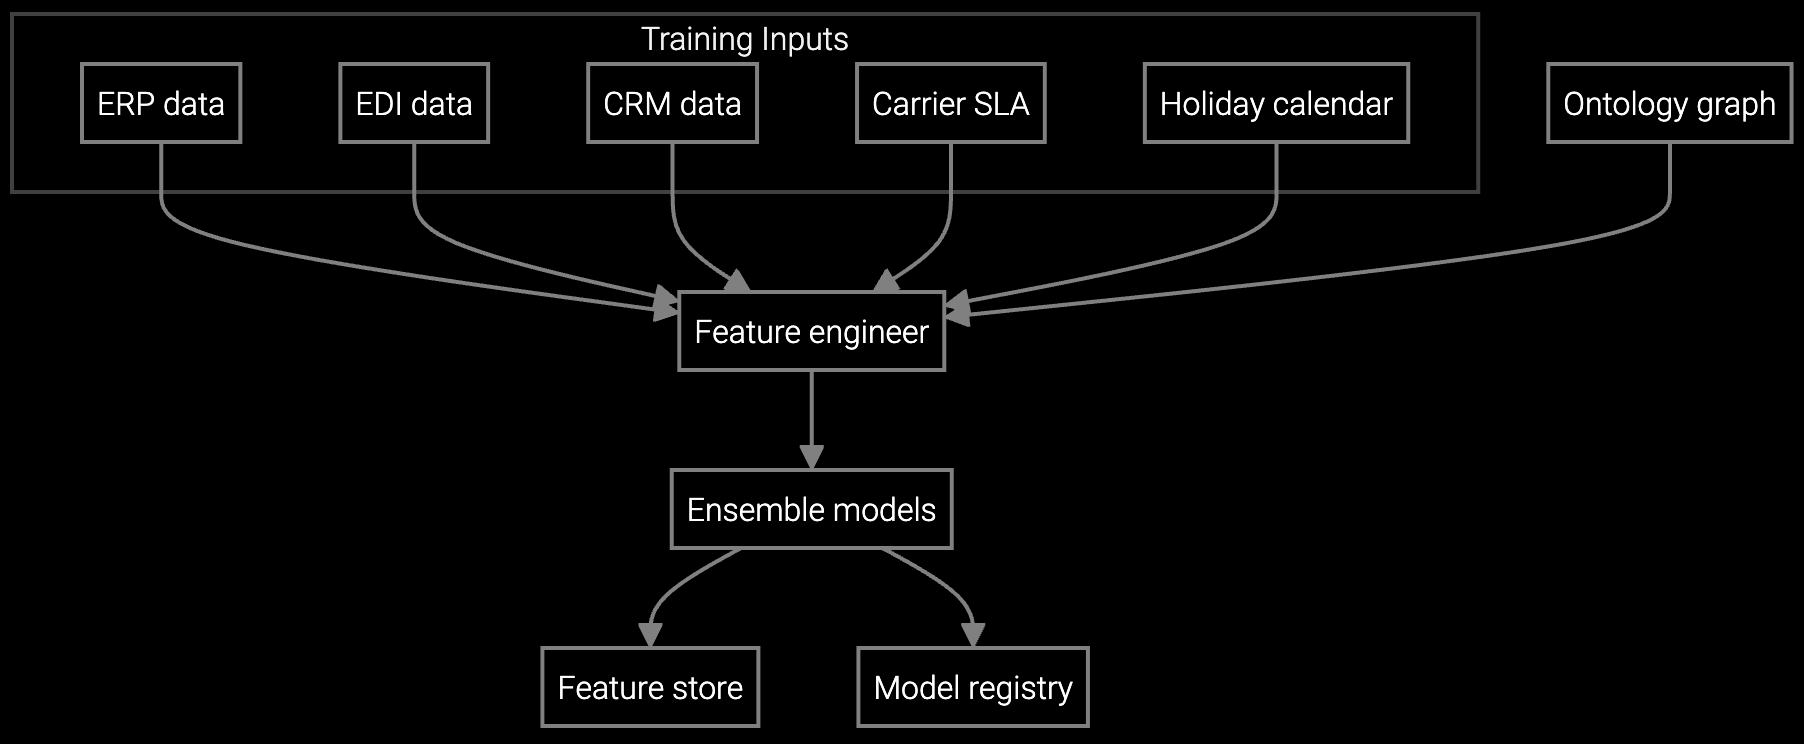
The platform ingests BMC telemetry, IPMI logs, and historical RMA data to forecast which components will fail and where. Instead of guessing stock levels or reacting to shortages, you see predicted demand by part number, location, and time window.
Automated replenishment recommendations balance carrying costs against stockout risk. The system suggests transferring parts between warehouses when one location shows rising failure probability, avoiding both excess inventory and emergency shipments. Fill rates stay above target while total inventory investment drops.
Forecast SSD and memory demand across hyperscale data centers by analyzing SMART data and server age cohorts.
Project power supply and cooling component consumption based on data center utilization patterns and thermal telemetry.
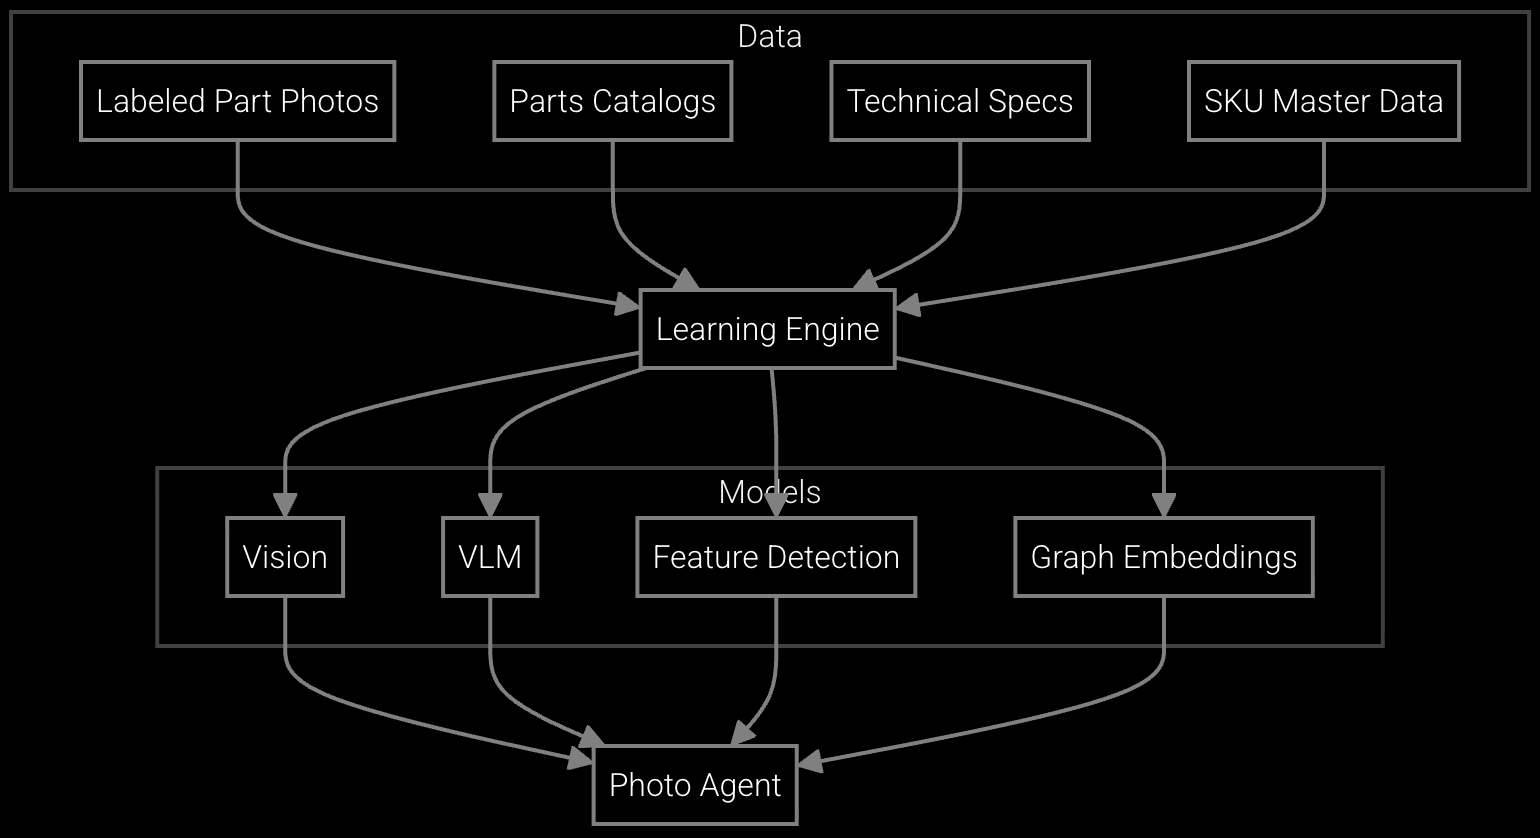
Snap a photo of a failed server component and instantly get part number, current stock levels, and alternative substitutes.
Data center OEMs face 4% annual hardware failure rates across thousands to millions of servers. SSDs, memory modules, and power supplies fail predictably based on age, usage, and thermal stress. Traditional inventory planning uses historical averages, missing the correlation between server cohort age and failure spikes.
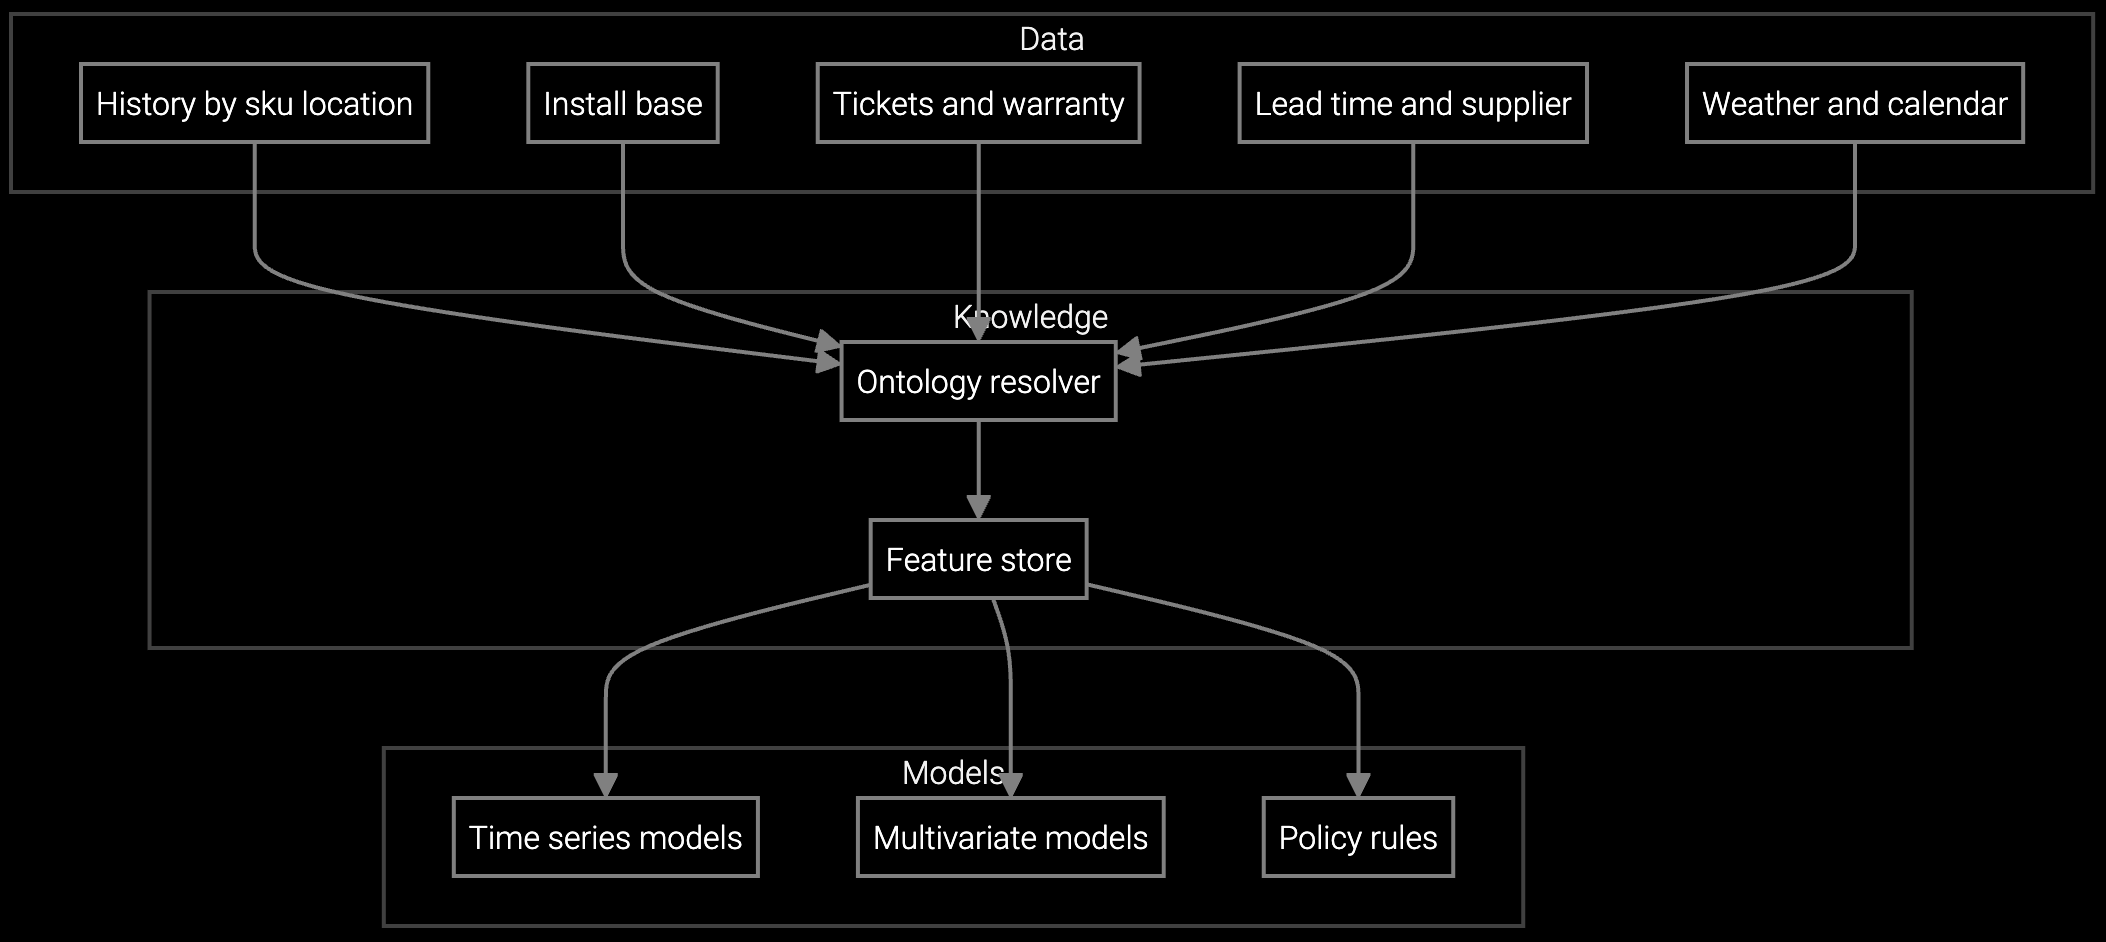
The platform analyzes BMC telemetry streams (temperature, power draw, SMART metrics) alongside installed base age to predict which components will fail in which locations. A three-year-old server cohort running hot workloads generates different part demand than new servers in cold aisles. Forecasts update daily as telemetry patterns shift.
Typical reductions range from 25-35% of total inventory investment by optimizing stock levels against predicted demand. The platform right-sizes inventory by part number and location, eliminating overstocking of slow-moving components while maintaining fill rates for high-failure parts.
Most data center OEMs see positive ROI within 6-9 months. Savings come from three sources: reduced carrying costs (immediate), fewer emergency shipments (within 60 days), and improved fill rates preventing SLA penalties (within 90 days). The combination typically recovers implementation costs in two quarters.
The platform analyzes BMC telemetry (temperature, power metrics, SMART data) alongside installed base age and usage patterns. Machine learning models detect early failure indicators like rising SSD wear leveling or memory error rates, then forecast which parts will fail in which locations over the next 30-90 days.
Yes. The platform provides location-level dashboards showing carrying cost trends, fill rates, and stockout incidents. You can compare inventory performance across regional distribution centers and identify where optimization efforts deliver the highest returns.
As the platform ingests more telemetry and RMA data, prediction accuracy increases. Better forecasts allow tighter inventory buffers without risking stockouts, compounding savings. Most customers see 10-15% additional carrying cost reduction in year two as models refine.

SPM systems optimize supply response but miss demand signals outside their inputs. An AI operating layer makes the full picture visible and actionable.
Advanced techniques for accurate parts forecasting.

AI-driven spare parts optimization for field service.
Calculate carrying cost savings and fill rate improvements for your data center operations.
Request ROI Analysis