Network downtime costs thousands per minute—support engineers need instant answers, not manual log parsing during critical outages.
AI-assisted remote diagnostics lift first-contact resolution to 50% or higher at L1 and L2, per Bruviti deployment data. Operators plug the layer into existing ticketing and telemetry without re-platforming, so frontline engineers close more incidents on the first touch. Rollout is staged by queue, keeping current support operations running while coverage expands.
Support engineers spend hours manually parsing syslog output and SNMP trap data across distributed network infrastructure. Pattern recognition depends entirely on individual experience, creating inconsistent diagnosis quality.
Critical troubleshooting knowledge lives in the heads of senior support engineers. Junior staff escalate issues they could resolve with proper guidance, creating unnecessary delays during network emergencies.
Support engineers toggle between remote access tools, monitoring dashboards, knowledge bases, and ticketing systems. Every interface switch during a critical incident adds friction and increases mean time to resolution.
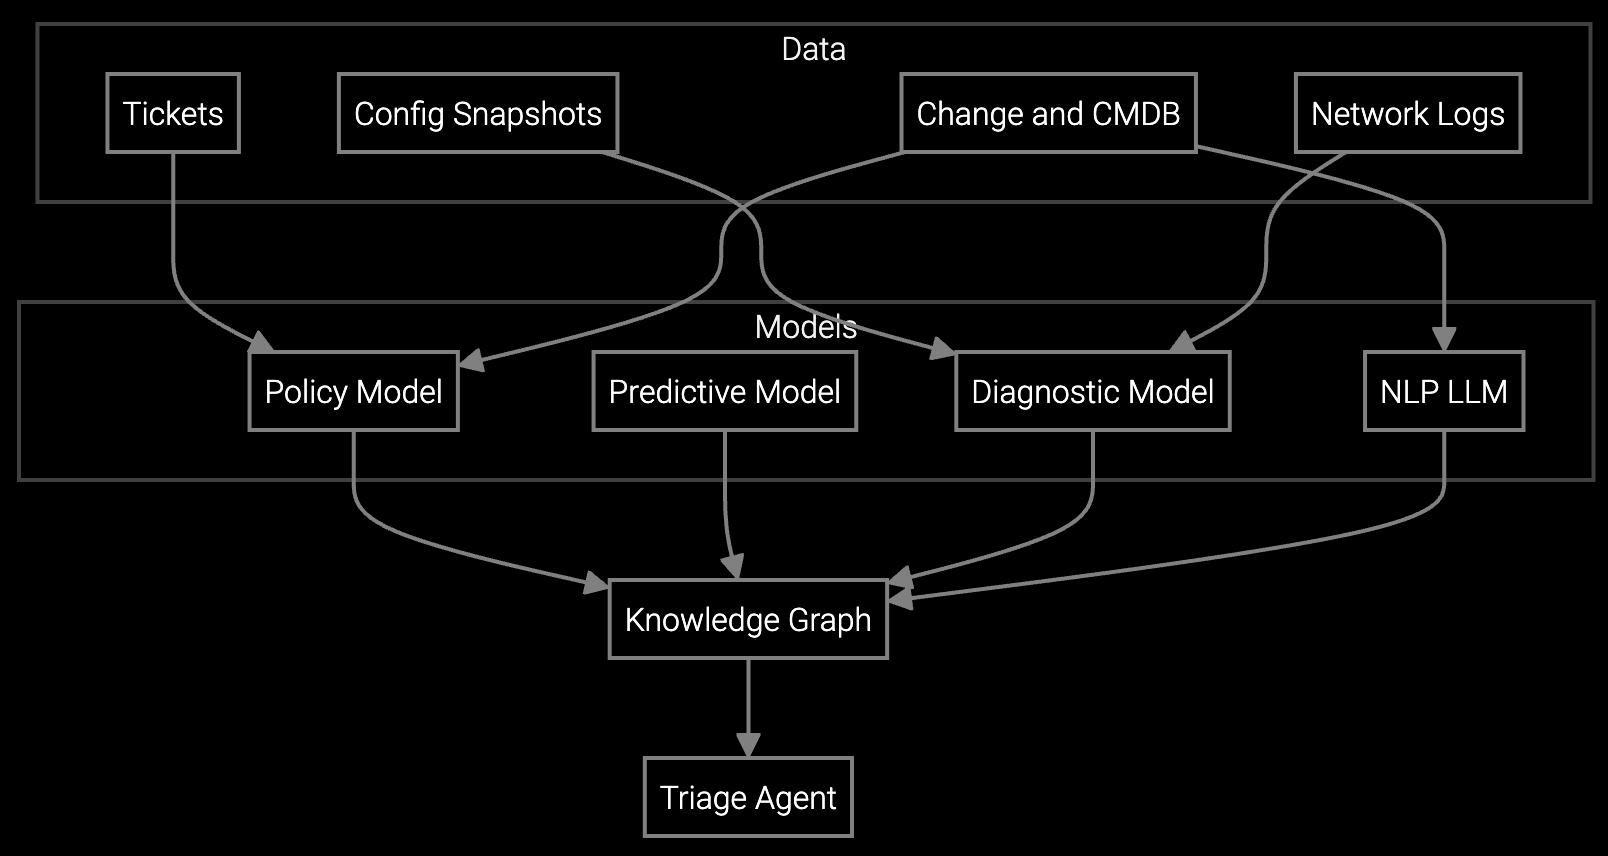
The platform ingests network telemetry streams—SNMP traps, syslog feeds, NetFlow data, and firmware logs—and correlates patterns across thousands of devices. Start by connecting your existing monitoring infrastructure to the platform's telemetry APIs. Historical incident data trains models to recognize failure signatures specific to your device population.
Guided troubleshooting workflows appear directly in your remote access tools. When a support engineer opens a session, the platform automatically analyzes current device state, correlates with similar past incidents, and surfaces step-by-step resolution paths. Engineers execute fixes faster without leaving their primary interface. Session outcomes feed back into the model, continuously improving diagnostic accuracy.
Network equipment generates massive telemetry volumes—SNMP traps every few seconds, syslog streams from thousands of devices, and configuration change logs across distributed NOCs. The platform's ingestion layer handles this scale while maintaining sub-second query performance for support engineers diagnosing live incidents.
Integration targets your existing monitoring stack—SolarWinds, PRTG, Nagios, or custom NOC tools. Telemetry parsers understand vendor-specific log formats from Cisco, Juniper, Arista, and Palo Alto devices. Models learn to differentiate between benign state changes (routine BGP flaps) and critical failure signatures (memory exhaustion patterns preceding device crashes).
Initial integration typically requires 2-3 weeks for API connection setup and telemetry validation across major device types. The platform includes pre-built parsers for standard SNMP MIBs and syslog formats from major vendors. Custom device types or proprietary log formats may add 1-2 weeks for parser development. Historical data ingestion runs in parallel and completes within 48 hours for most deployments.
Yes, the platform includes vendor-specific parsers for major network equipment manufacturers including Cisco IOS/NX-OS, Juniper Junos, Arista EOS, and Palo Alto PAN-OS. Models correlate events across vendor boundaries—for example, linking a Cisco router BGP flap to downstream Juniper switch port errors. Custom parsers can be added for proprietary or legacy equipment within the integration timeline.
The platform provides browser extensions and API integrations for major remote access tools including TeamViewer, LogMeIn, and VNC. Guided workflows appear as side panels or overlay windows within the remote session interface. Support engineers see contextual troubleshooting steps based on real-time device telemetry without switching applications. Session actions feed back to improve model accuracy for similar future incidents.
For novel issues, the platform surfaces the closest historical matches based on symptom similarity and device context. Support engineers follow standard escalation procedures while documenting the resolution. The platform captures this new resolution path and incorporates it into the model within 24 hours. Over time, coverage expands to include increasingly rare failure modes specific to your device population.
The platform dashboards track remote resolution rate, escalation rate, and mean session duration with before/after comparison. Track these metrics weekly during the first 90 days post-deployment. Most network equipment deployments show measurable improvement within 30 days as models learn device-specific failure patterns. Export metrics to demonstrate ROI in quarterly NOC performance reviews.

Software stocks lost nearly $1 trillion in value despite strong quarters. AI represents a paradigm shift, not an incremental software improvement.
Function-scoped AI improves local efficiency but workflow-native AI changes cost-to-serve. The P&L impact lives in the workflow itself.

Five key shifts from deploying nearly 100 enterprise AI workflow solutions and the GTM changes required to win in 2026.
See how Bruviti integrates with your network monitoring infrastructure and remote access tools in under 30 minutes.
Schedule Technical Demo