When support engineers need answers in seconds, not hours, every setup step counts.
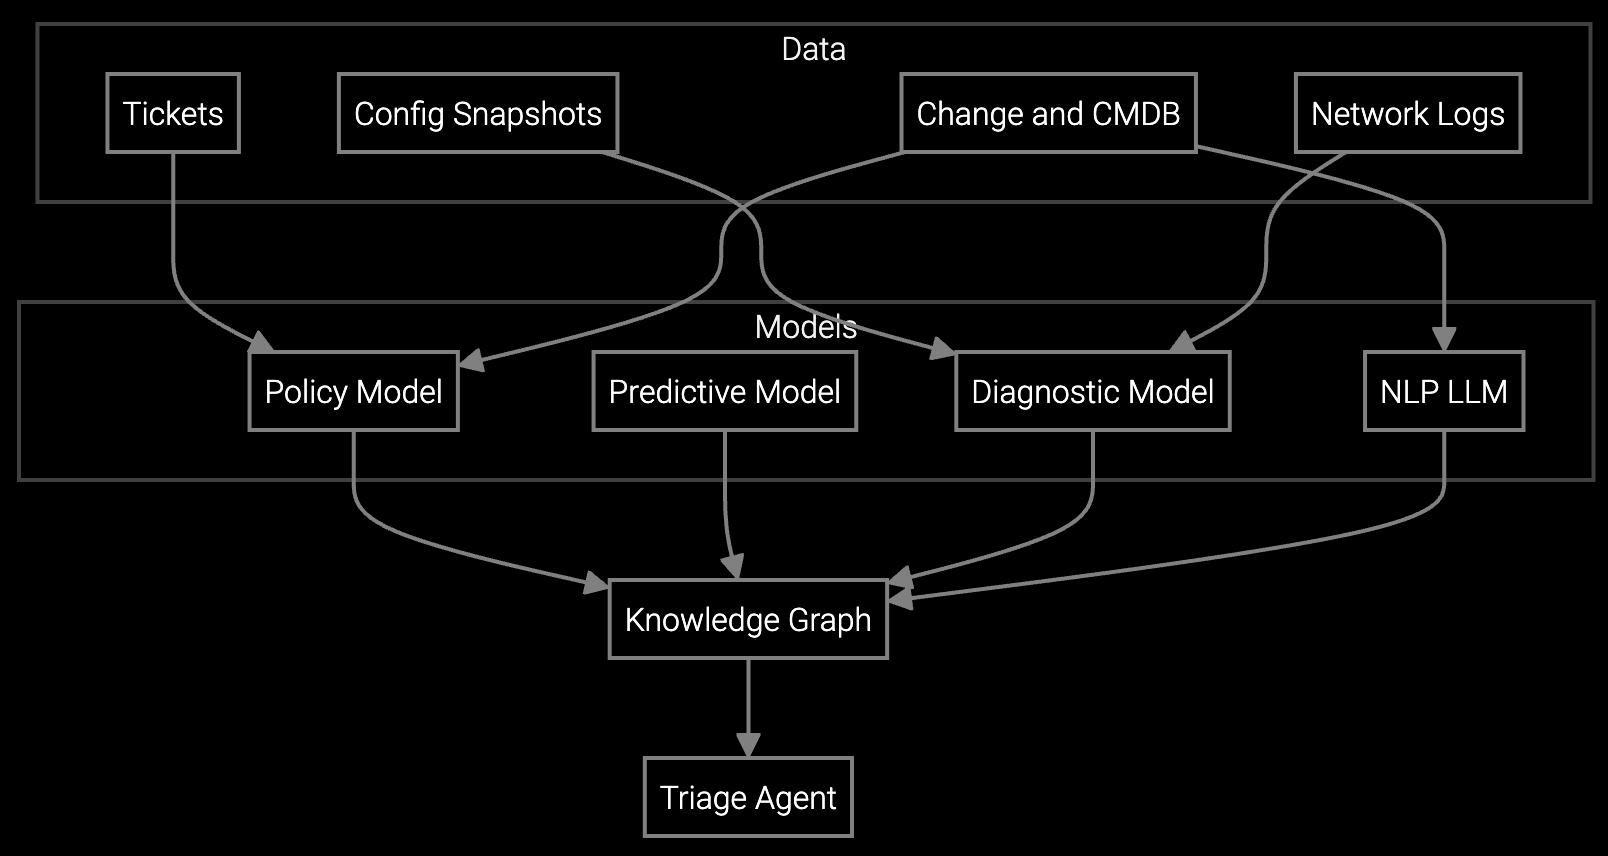
Bruviti deployment data shows guided remote diagnostics deliver 20 to 30% faster resolution with 60% guided auto-triage on faults. Operators connect equipment logs and telemetry, let the assistant suggest the likely cause and next step, and resolve more cases remotely before dispatching anyone. Setup follows the existing service workflow, no new tooling required.
Support engineers spend hours configuring telemetry feeds for each server model. Different BMC firmware versions require custom parsing logic, and firewall rules block remote access.
Remote sessions require switching between 6+ tools: IPMI console, log viewers, knowledge base, ticketing system, parts lookup, and configuration management. Each tool needs separate credentials and training.
Support engineers manually parse 500+ line log files to identify root cause. Memory failures, thermal events, and firmware errors hide in unstructured text that takes 20+ minutes to analyze per incident.
The platform connects directly to your existing BMC/IPMI infrastructure through standard protocols. Point it at your telemetry endpoints, and automated discovery maps all server models, firmware versions, and configuration baselines. No custom integration code required.
Deploy the diagnostic agent as a lightweight container on your remote access platform. It parses logs in real time, correlates telemetry patterns, and surfaces root cause analysis directly in your support engineer's workflow. One unified interface replaces tool-switching. Setup completes in 2-3 days with minimal IT involvement.
Data center OEMs manage thousands of servers across multiple customer sites, each with unique firmware versions, power configurations, and thermal profiles. The platform ingests BMC/IPMI telemetry at scale, automatically detecting PUE anomalies, hot spots, and predictive failure signals across diverse hardware generations.
Support engineers access unified diagnostics for compute nodes, storage arrays, PDUs, and UPS systems in a single interface. When a customer reports degraded performance, the platform correlates server logs with cooling system telemetry to pinpoint thermal management issues before they cascade into SLA violations.
No. The platform integrates with your current remote access setup. It surfaces diagnostic insights directly in your workflow without replacing tools your support engineers already know.
Automated discovery maps most server models in 30-45 minutes. The platform recognizes standard BMC firmware versions and adapts to custom configurations. You configure once per model family, not per individual server.
The platform uses standard IPMI ports and protocols already allowed for remote management. For restricted environments, deploy the agent on-premises behind the firewall and sync diagnostic results outbound on customer-approved schedules.
Yes. The platform parses telemetry from any BMC-compliant hardware. If your customers run mixed vendors, it correlates logs across OEMs to identify cross-platform issues like power distribution or cooling failures.
Instead of manually reading 500-line log files, support engineers see root cause summaries in 90 seconds. The platform flags memory errors, thermal events, and firmware mismatches with specific remediation steps, eliminating guesswork.

Software stocks lost nearly $1 trillion in value despite strong quarters. AI represents a paradigm shift, not an incremental software improvement.
Function-scoped AI improves local efficiency but workflow-native AI changes cost-to-serve. The P&L impact lives in the workflow itself.

Five key shifts from deploying nearly 100 enterprise AI workflow solutions and the GTM changes required to win in 2026.
Our integration team walks you through BMC connection, agent deployment, and workflow configuration.
Schedule Setup Call