Carrying costs for router and switch spares eat 22-28% of parts value annually while stockouts trigger SLA penalties.
Automated parts management cuts manual identification time 65% for network equipment, per Bruviti deployment data. Operators no longer hunt through manuals to match a failed component, which compresses labor cost per work order and frees planners for exception handling instead of routine part lookups across the service fleet.
Carrying slow-moving spares for EOL routers and legacy firmware versions ties up capital. Network OEMs stock 3-5 years of tail inventory because failure patterns are unpredictable.
Stockouts at regional depots force same-day air shipments from central warehouses. When a data center switch fails, every hour of downtime costs the customer thousands.
Finding compatible alternatives for out-of-stock components requires searching through engineering docs and firmware compatibility matrices. Service coordinators spend 15-30 minutes per lookup.
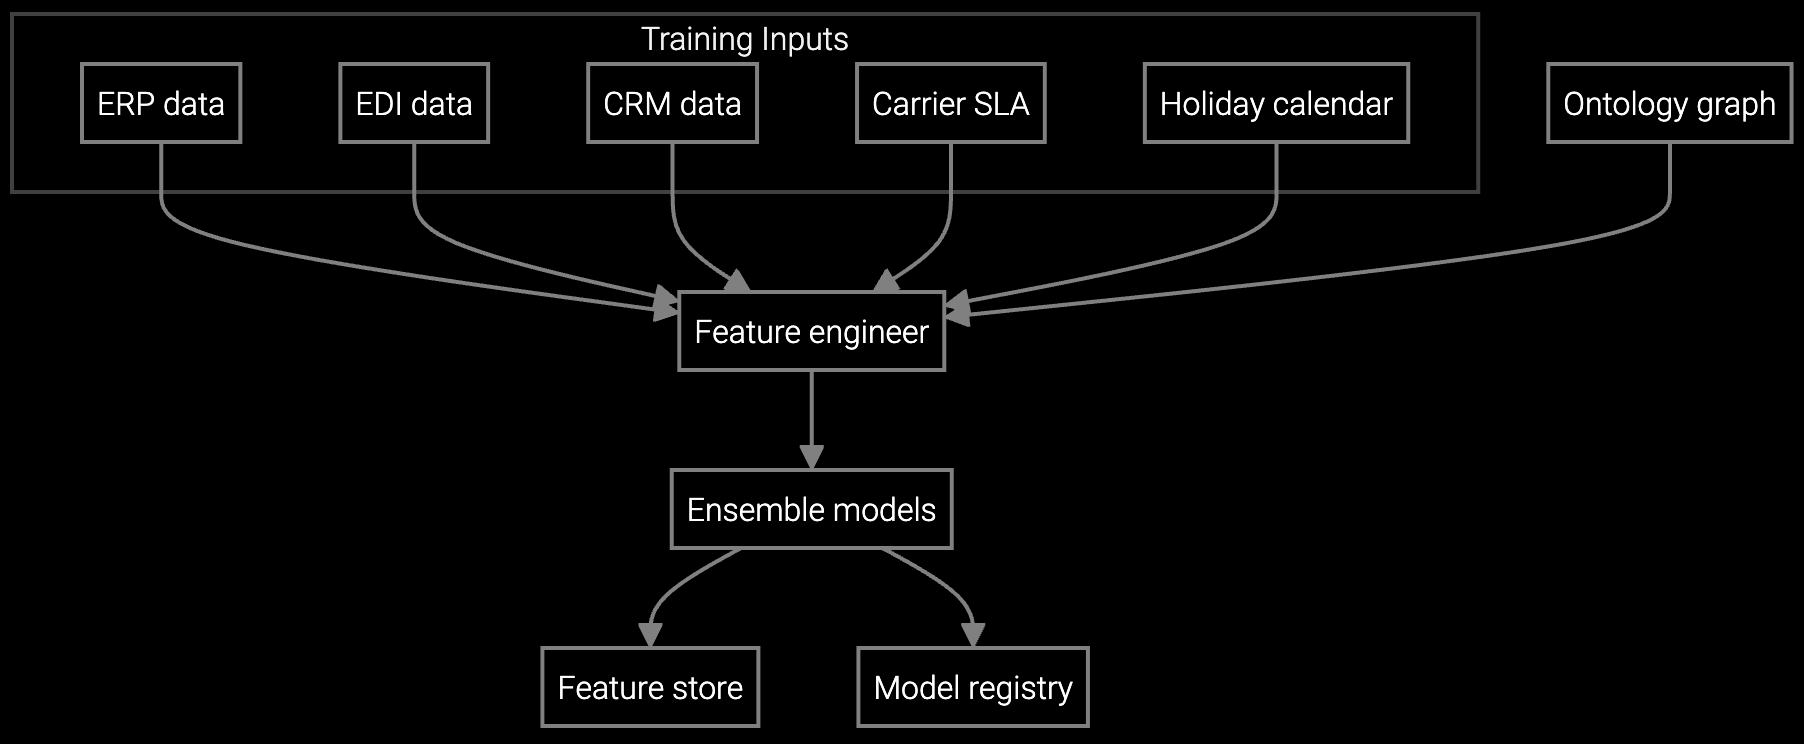
Bruviti's platform ingests install base telemetry, RMA history, and service case data to predict which parts will fail at which locations. Demand forecasts account for device age, firmware version, environmental factors, and seasonal usage patterns. The platform automatically rebalances stock between regional depots based on predicted demand windows.
When a part is unavailable, the system instantly surfaces compatible substitutes by analyzing engineering specs, firmware compatibility, and physical fit dimensions. Service coordinators see availability and pricing for alternatives without leaving the case screen. The platform tracks substitute usage patterns to refine recommendations over time.
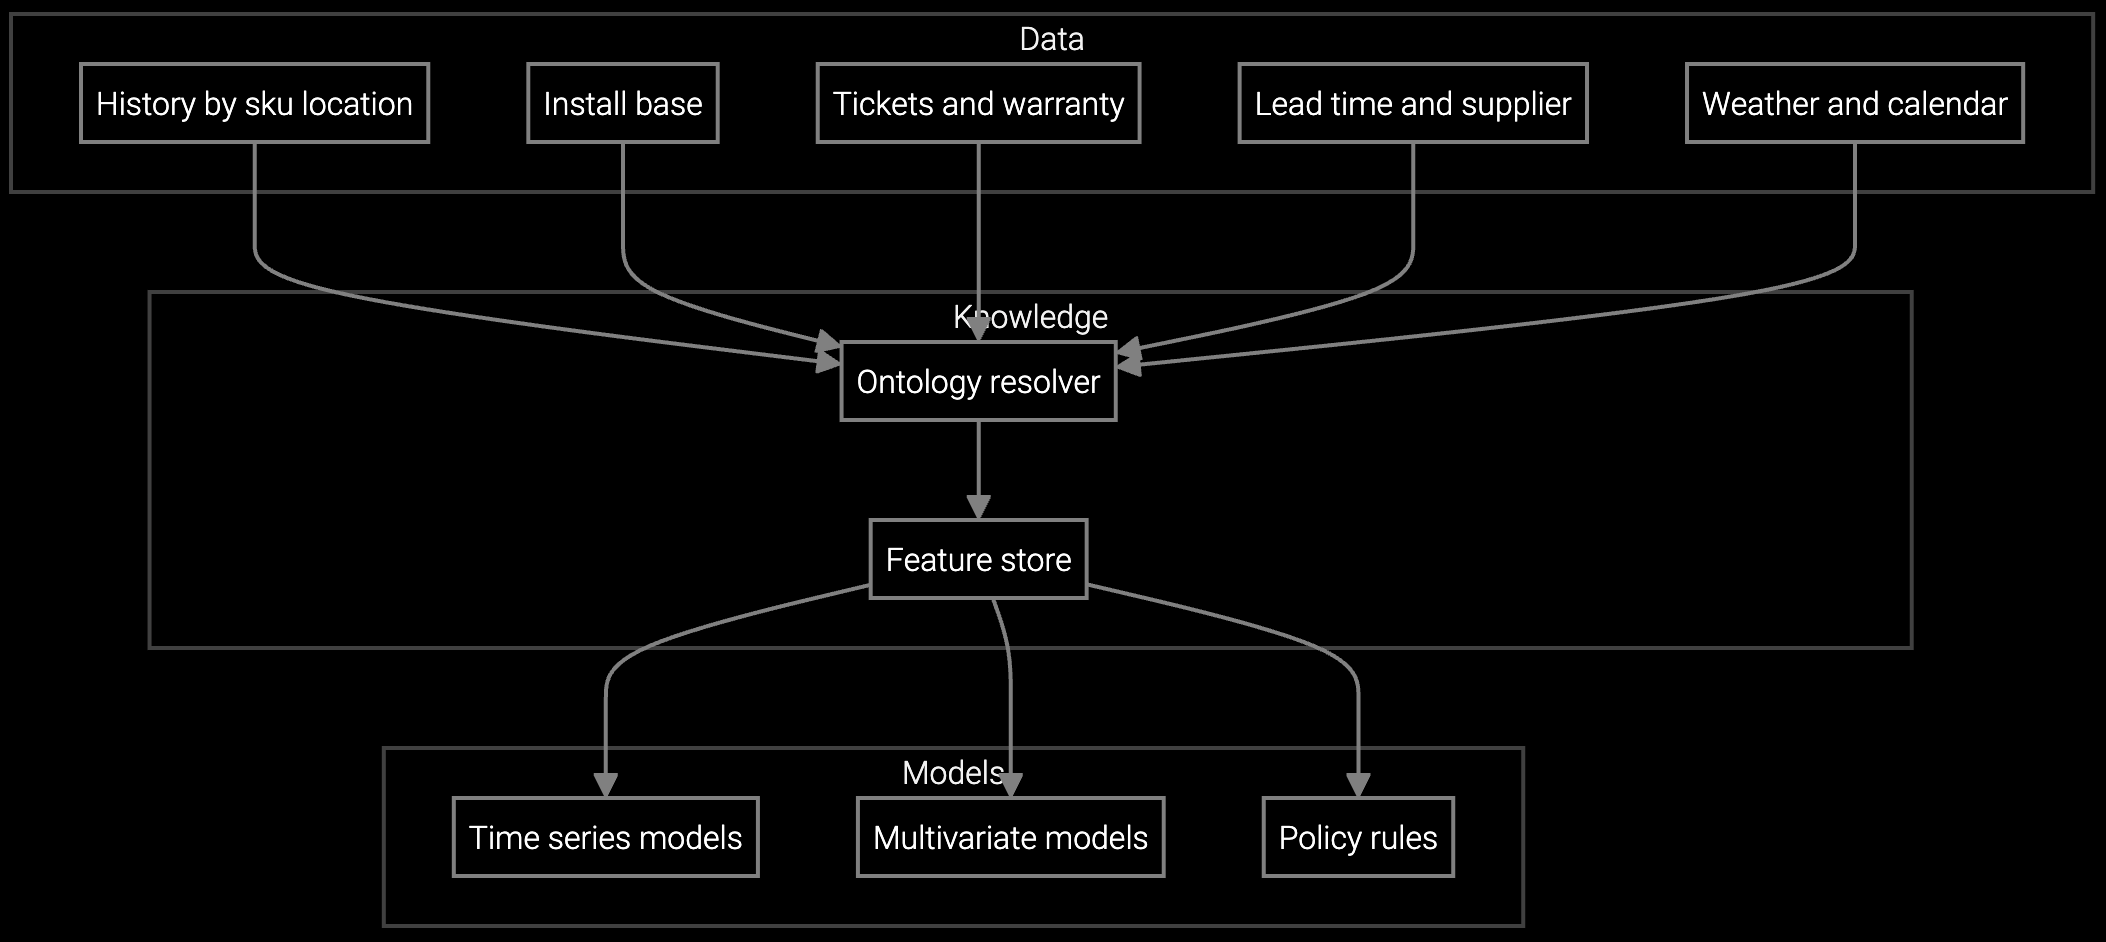
Projects router and switch failure rates by model, firmware version, and region to optimize parts stocking levels.
Automatically rebalances network equipment spares between depots based on predicted demand windows and service velocity.
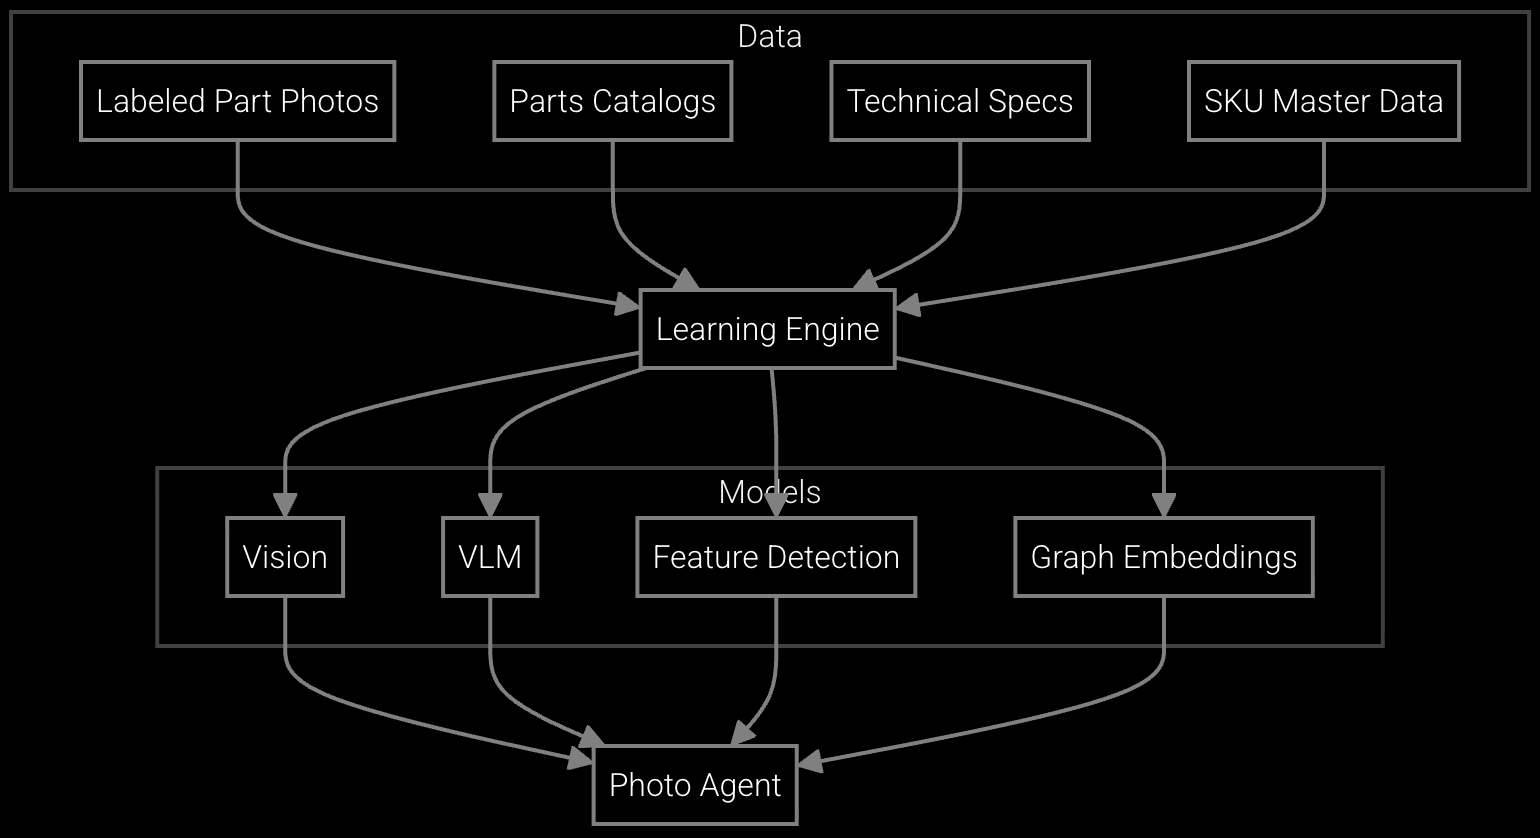
Snap a photo of a failed power supply or line card to get instant part number identification and substitute availability.
Network equipment OEMs support devices deployed across enterprise data centers, carrier central offices, and remote cell sites. Routers and switches have 5-7 year service contracts with 4-hour SLA commitments for mission-critical installations. Parts inventory spans hundreds of line cards, power supplies, fan trays, and optics modules across multiple hardware generations and firmware branches.
The challenge intensifies with long product lifecycles and gradual rollouts. A single enterprise customer may operate five generations of switches simultaneously, each requiring different spare parts. Firmware updates change failure patterns, making historical RMA data less predictive. Regional depots must stock parts for both current and legacy devices without knowing which will fail next.
Inventory optimization takes 6-12 months to fully materialize as stock levels adjust through natural consumption rather than write-offs. Most OEMs see measurable reductions in safety stock within the first quarter and reach target carrying cost savings by month 9-12 as the platform refines forecasts with actual failure data.
Device telemetry showing error rates, temperature trends, and fan failures provides the strongest predictive signal. RMA history grouped by firmware version and deployment environment adds context about failure patterns. Service contract data reveals which devices have SLA commitments requiring faster parts availability, helping prioritize stock positioning.
The system tracks install base age and service contract expiration dates to project remaining demand for legacy parts. It recommends substitute parts from newer product lines where firmware compatibility allows. For critical components with no substitutes, it flags approaching obsolescence 12-18 months ahead so procurement can secure final buys before suppliers discontinue production.
Yes, by tracking time from part unavailability to case resolution and correlating with CSAT scores. OEMs typically see case resolution time drop 30-40% when substitute parts are identified in under 2 minutes versus 20+ minutes of manual lookup. Faster resolution directly improves CSAT, especially for customers facing network downtime.
For OEMs carrying $15-25M in network equipment spares, 18-25% carrying cost reduction yields $2.7-6.3M annually. Most reach ROI within 8-14 months after accounting for platform costs, integration effort, and ramp time. Larger OEMs with distributed depot networks and high emergency shipment volumes see faster payback due to combined inventory and freight savings.

SPM systems optimize supply response but miss demand signals outside their inputs. An AI operating layer makes the full picture visible and actionable.
Advanced techniques for accurate parts forecasting.

AI-driven spare parts optimization for field service.
See how network equipment OEMs are reducing carrying costs and improving fill rates with Bruviti.
Schedule Demo