Service parts inventory represents 18-25% annual cost for network OEMs—yet stockouts still delay critical customer repairs.
A network parts forecasting platform saves 400+ engineering hours per month, per Bruviti deployment data, the largest line item in the build-vs-buy math. Those hours come from automated parts data extraction and catalog maintenance that would otherwise consume an engineering team, making the platform pay back through reclaimed headcount, not just inventory savings.
Network equipment parts have short lifecycles due to rapid firmware evolution and component obsolescence. Overstocking legacy router modules or switch line cards ties up capital that depreciates as EOL approaches.
When critical network infrastructure fails, customers expect four-hour SLAs. Stockouts force overnight air freight of power supplies or optics modules at 8-12x standard shipping cost.
Traditional demand planning relies on historical sales patterns, missing failure rate shifts from firmware updates or environmental factors affecting network deployment sites.
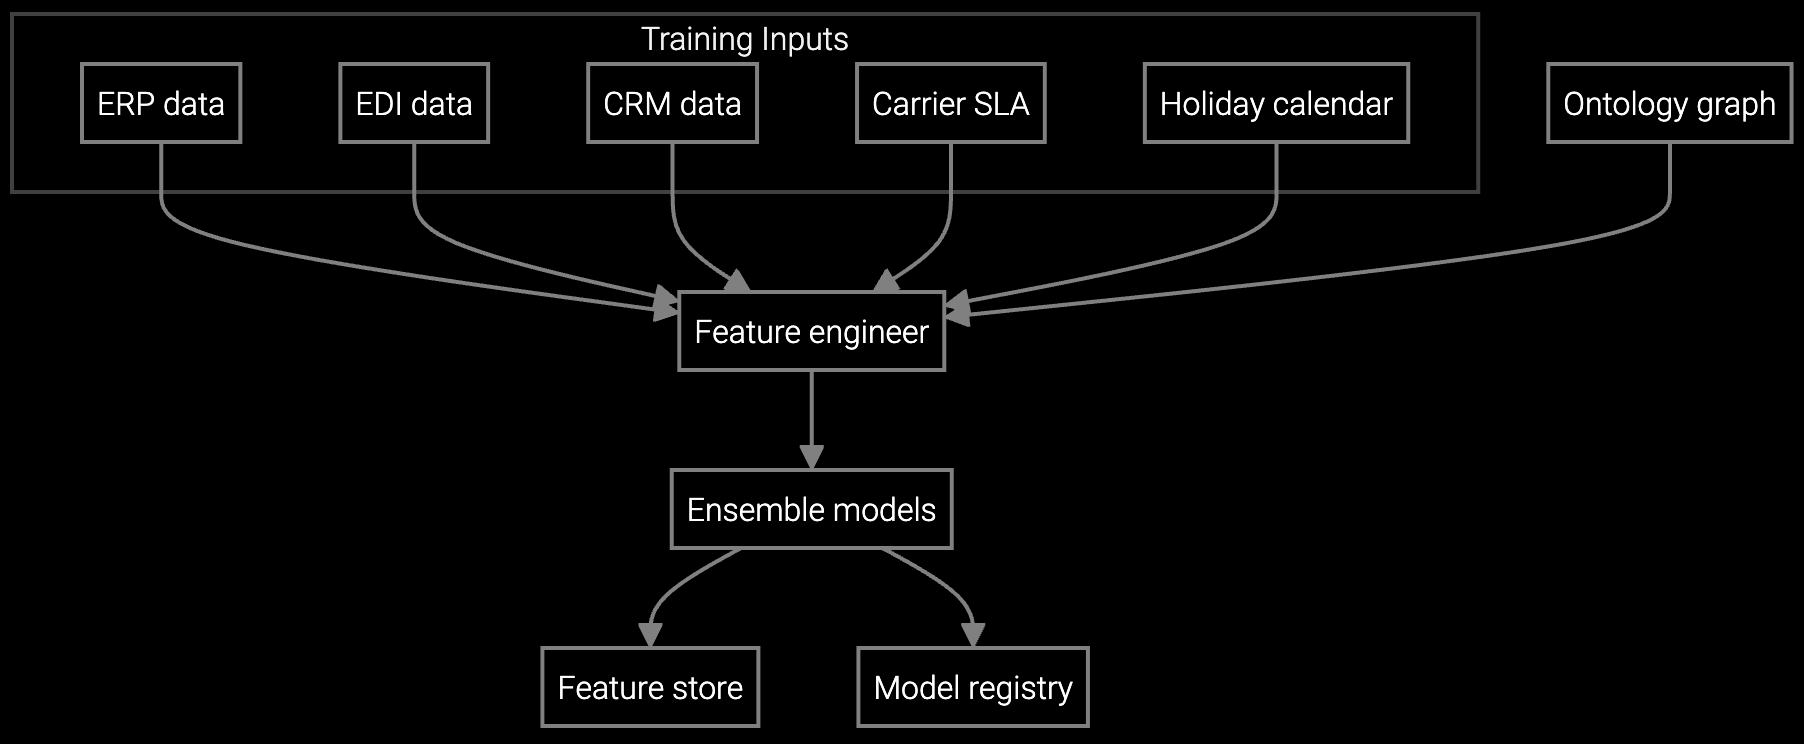
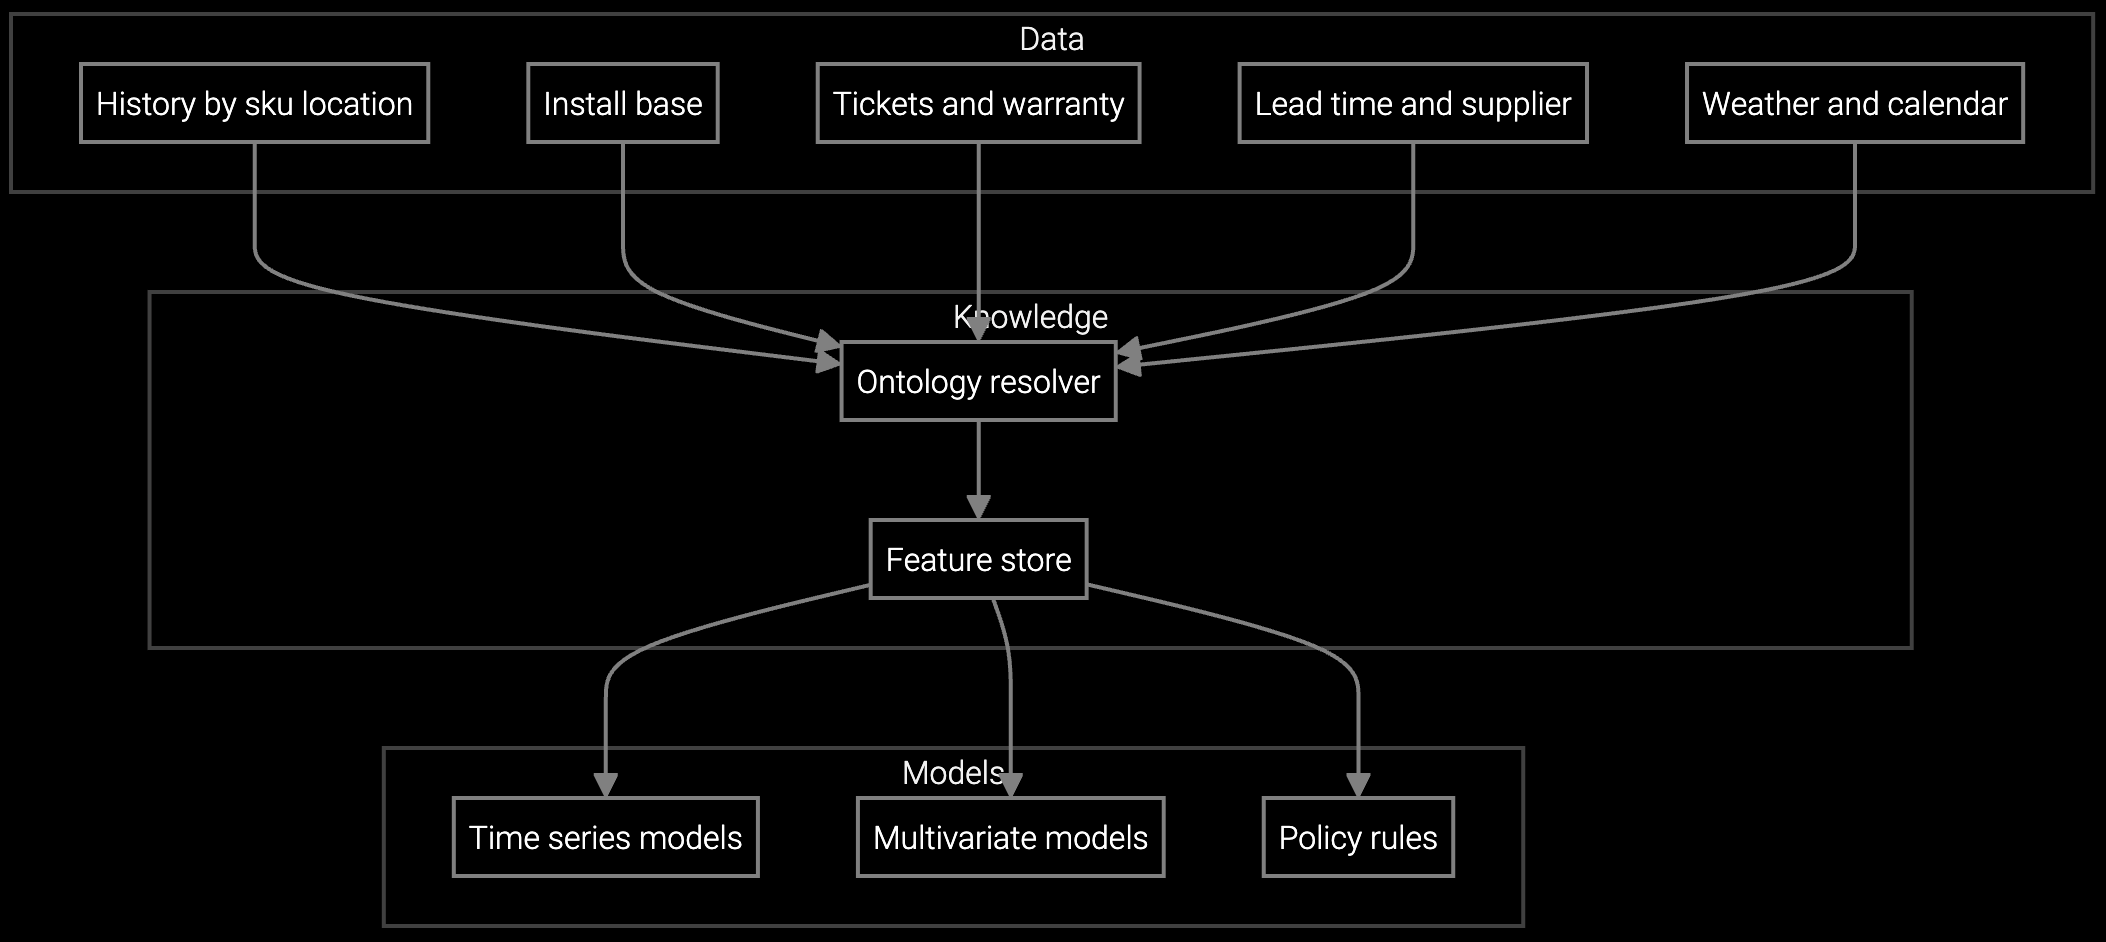
Bruviti's platform ingests telemetry streams from deployed network equipment (SNMP traps, syslog, device health APIs) and correlates failure patterns with parts consumption across your installed base. The forecasting engine runs Python-based models that factor in device age, firmware version, environmental conditions, and seasonal traffic patterns to predict regional demand by SKU.
For builders, the architecture matters: RESTful APIs expose forecast data to your ERP or warehouse management system without vendor lock-in. You train custom models on your proprietary failure data using our SDK, then deploy them via container orchestration. The platform handles the heavy lifting—ingesting terabytes of device telemetry—while you control the business logic for replenishment triggers and safety stock calculations.
Forecasts router and switch part demand by distribution center using failure telemetry and installed base age, optimizing stock levels for 99.9% uptime SLAs.
Projects consumption of optical transceivers and power supplies based on network traffic patterns and environmental stress factors at data center sites.
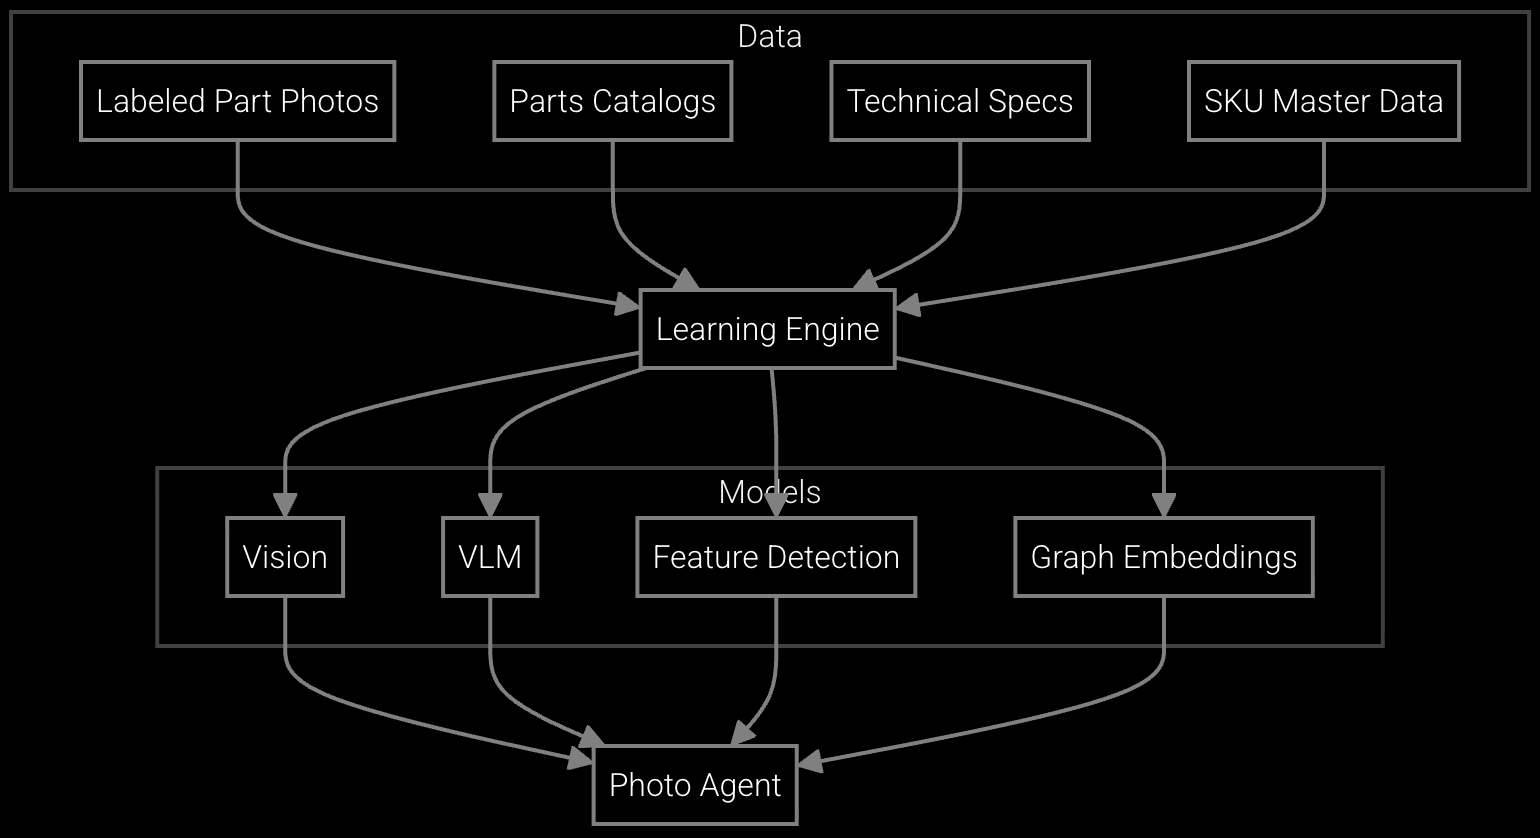
Field engineers photograph failed line cards or fan trays to get instant SKU identification and availability, accelerating RMA processing for network outages.
Network infrastructure operates on 5-7 year refresh cycles, but component obsolescence hits sooner. A chassis-based switch may remain in production, but specific line cards go EOL within 24 months as ASICs evolve. Your customers—enterprises running NOCs or carriers managing cell tower backhaul—expect immediate replacement for failed components that cripple network uptime.
The forecasting challenge differs from appliances: failure rates correlate with traffic load and environmental factors (temperature swings in remote sites, humidity in coastal deployments). Traditional time-series models miss these variables. Telemetry-driven forecasting captures the signals that matter: error rate spikes in optics modules, fan failures correlated with ambient temperature, power supply degradation patterns.
ROI comes from three sources: reduced carrying costs (30-40% reduction through optimized inventory turns), eliminated emergency shipment fees (60-75% fewer expedites), and avoided SLA penalties from stockout-delayed repairs. For a $50M network OEM, this typically yields $2.5M-$4M annual savings against $400K platform investment.
The platform ingests device telemetry (SNMP traps, syslog, health check APIs), RMA history, warranty claim records, installed base demographics (device age, firmware version, site location), and environmental data where available. You control data sovereignty—models run in your VPC or on-premises using our containerized SDK.
Most network OEMs see 8-12 percentage point accuracy gains within 90 days of model deployment. The forecasting engine needs 6-12 months of telemetry history to capture seasonal patterns and firmware-related failure rate shifts. Early wins come from high-volume SKUs with consistent failure modes.
Yes. The platform exposes forecast data via RESTful APIs with pagination and filtering. We provide Python and TypeScript SDKs with sample code for SAP Business One, Oracle Cloud, and custom data lakes. You own the integration logic—no middleware lock-in.
Track inventory turns (target 6-8x annually), fill rate (target 96%+), carrying cost as percentage of inventory value (target reduction to 14-16%), emergency shipment spend, and stockout incidents causing SLA breaches. Compare baseline period to post-deployment quarters for board-ready ROI analysis.

SPM systems optimize supply response but miss demand signals outside their inputs. An AI operating layer makes the full picture visible and actionable.
Advanced techniques for accurate parts forecasting.

AI-driven spare parts optimization for field service.
Talk to our team about quantifying forecast accuracy gains and carrying cost reductions for your network equipment portfolio.
Schedule ROI Assessment