Server failures are predictable, but excess inventory costs millions—how do you measure the payback?
Bruviti deployment data shows AI parts forecasting cuts catalog authoring time by 70% for data center OEMs. The compiler builds structured parts catalogs automatically from source documents, freeing engineering to focus on product work instead of data entry. Deployment data ties the savings to automated extraction replacing manual catalog assembly.
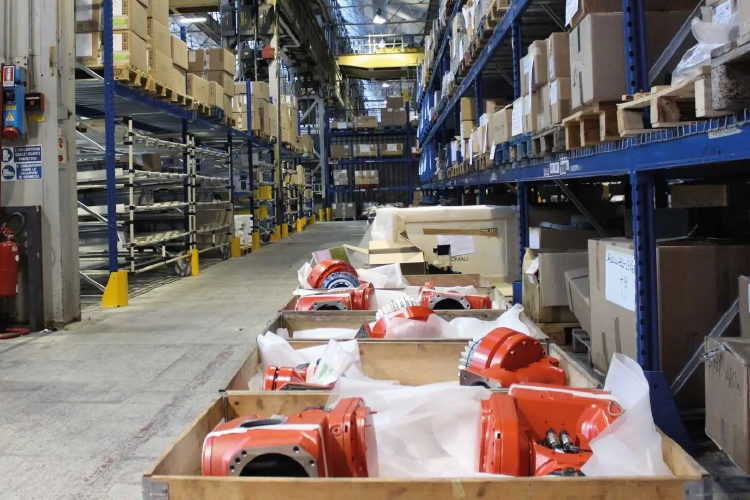
Server component lifecycles are short, but unpredictable failure patterns force OEMs to maintain large safety stocks. Memory modules, SSDs, and power supplies have high unit costs and rapid obsolescence risk.
Data center customers demand four-nines availability. Missing a critical part means same-day emergency shipments at 3-5x cost, or worse, SLA penalty payments that dwarf the part's value.
Hyperscale customers operate globally. Your ERP shows total inventory, but not which regional warehouse has the right RAID controller for an EU customer with a cooling system failure.
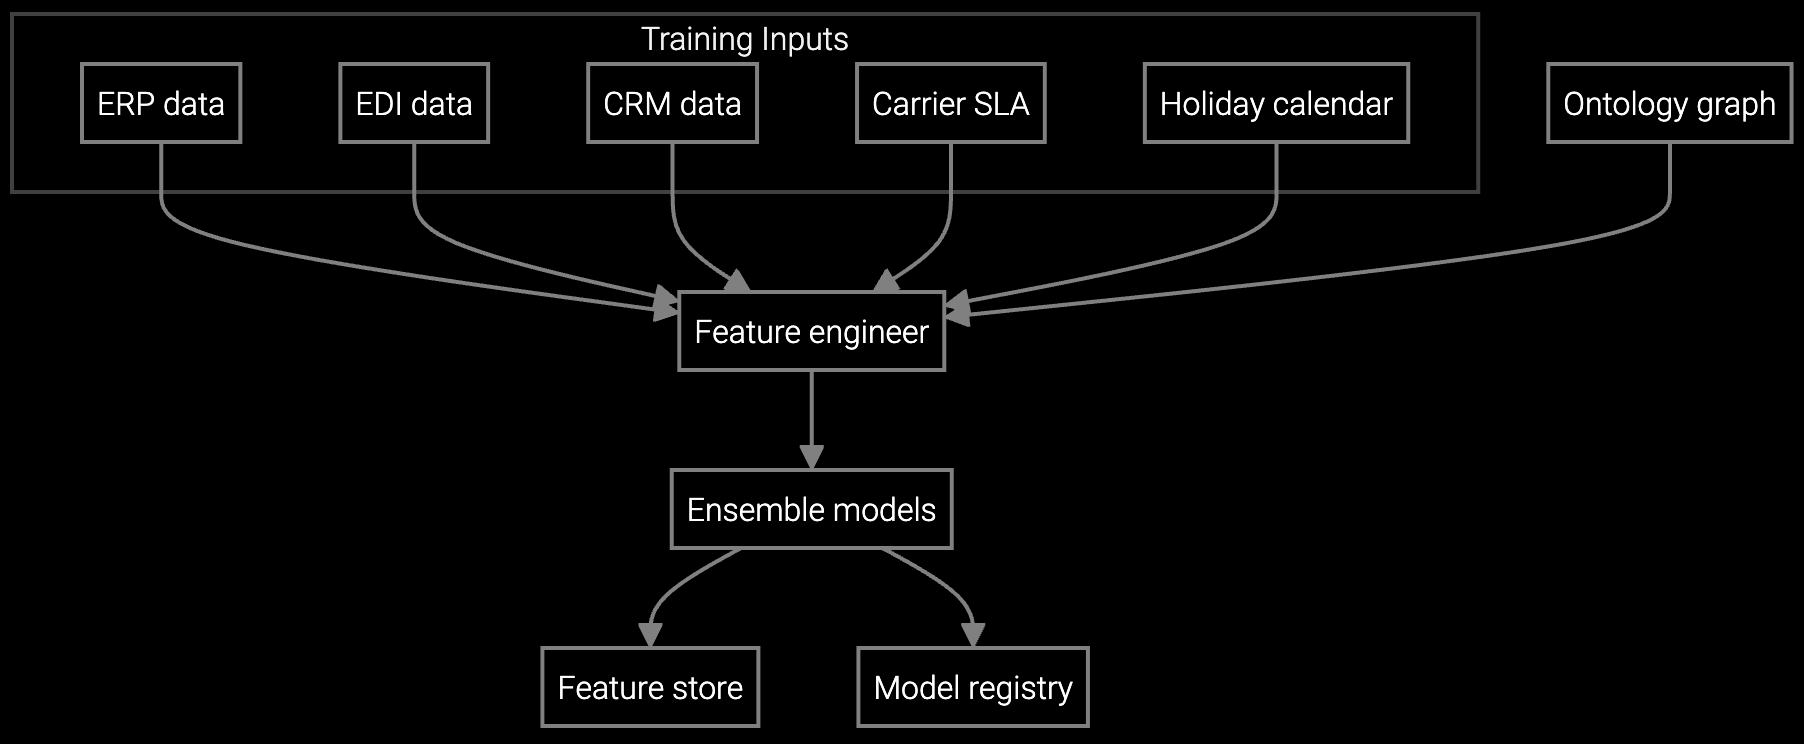
Bruviti's platform ingests BMC telemetry, warranty claims, and historical failure data to predict component-level demand by location and time window. The Python SDK connects to SAP or Oracle inventory systems, allowing your data engineers to train custom forecasting models without rebuilding data pipelines from scratch.
The API returns demand forecasts as JSON with confidence intervals, enabling your existing replenishment logic to optimize stock levels. Because the integration is headless, you maintain control over business rules—Bruviti provides the prediction layer, not another ERP to replace. This architecture delivers measurable cost reduction within two quarters while avoiding vendor lock-in.
Forecasts server component demand by data center region and time window, balancing fill rate targets against carrying cost constraints for PDUs, memory, and storage.
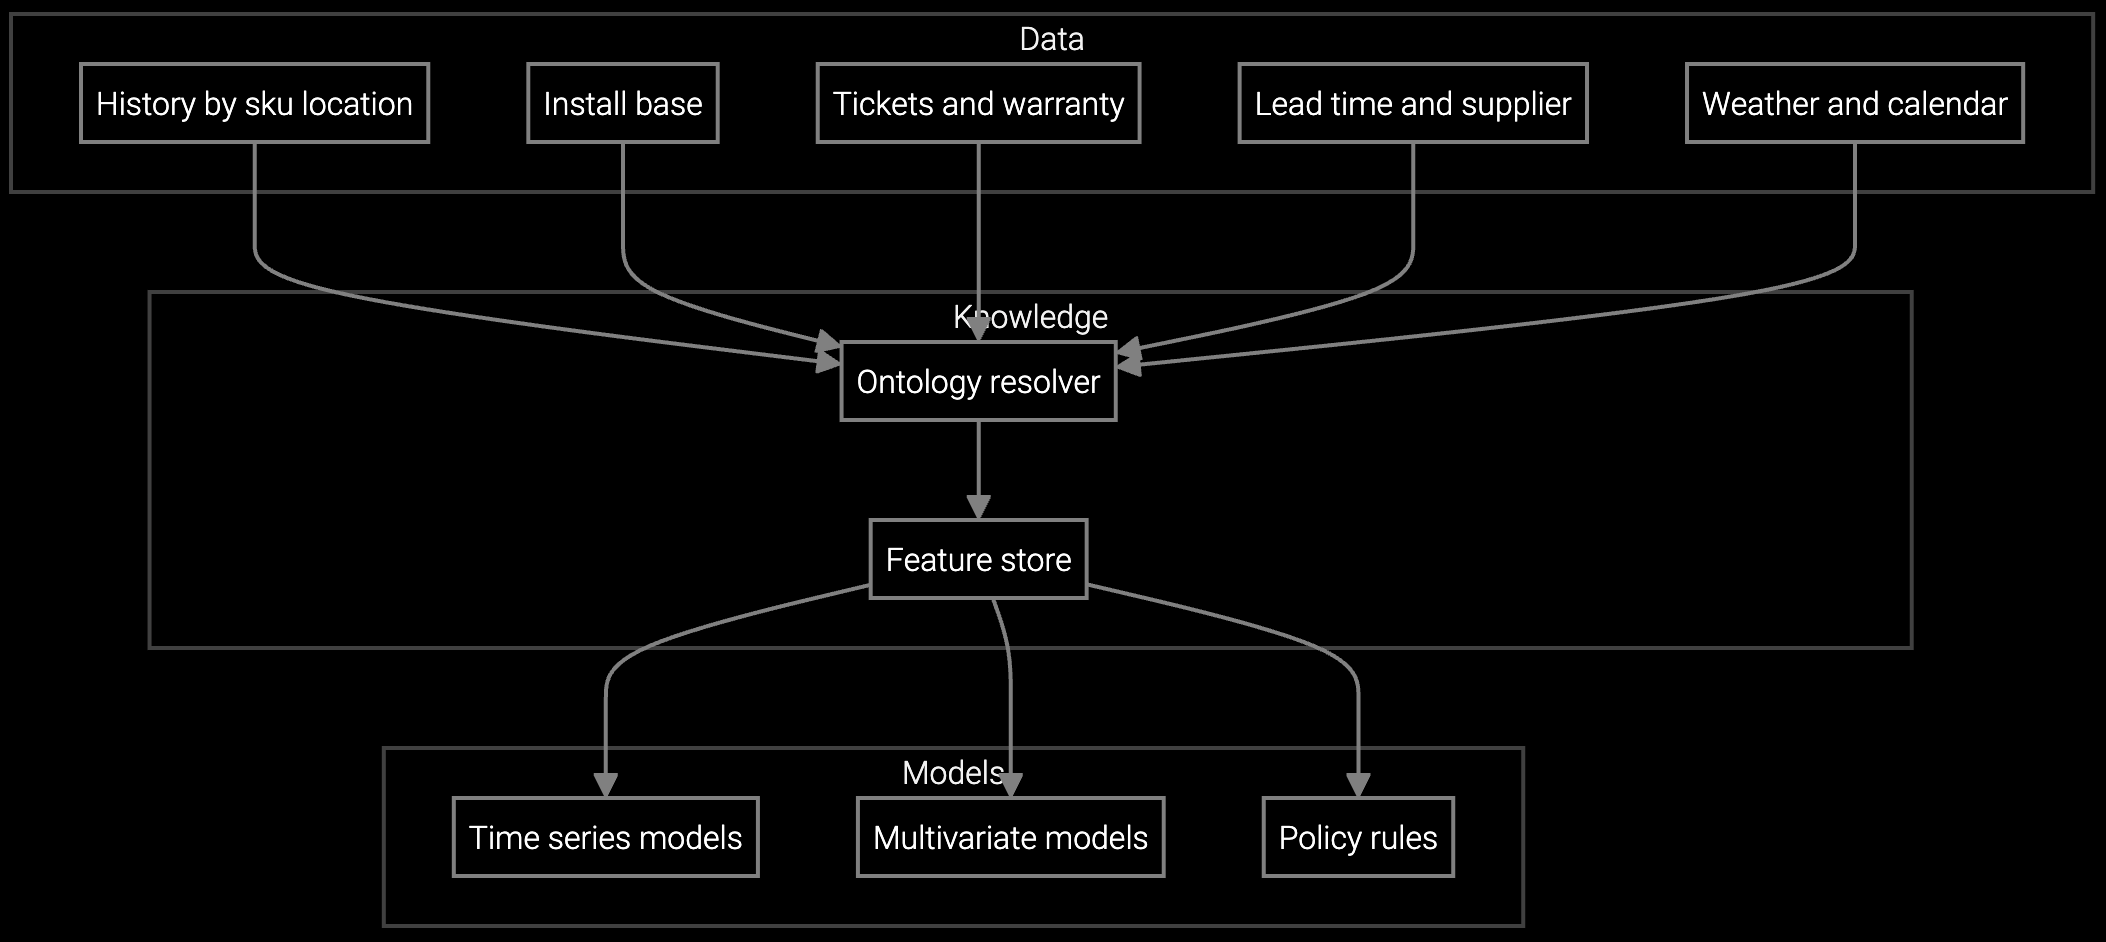
Projects cooling system and power supply consumption based on installed base age, thermal telemetry patterns, and seasonal data center capacity trends.
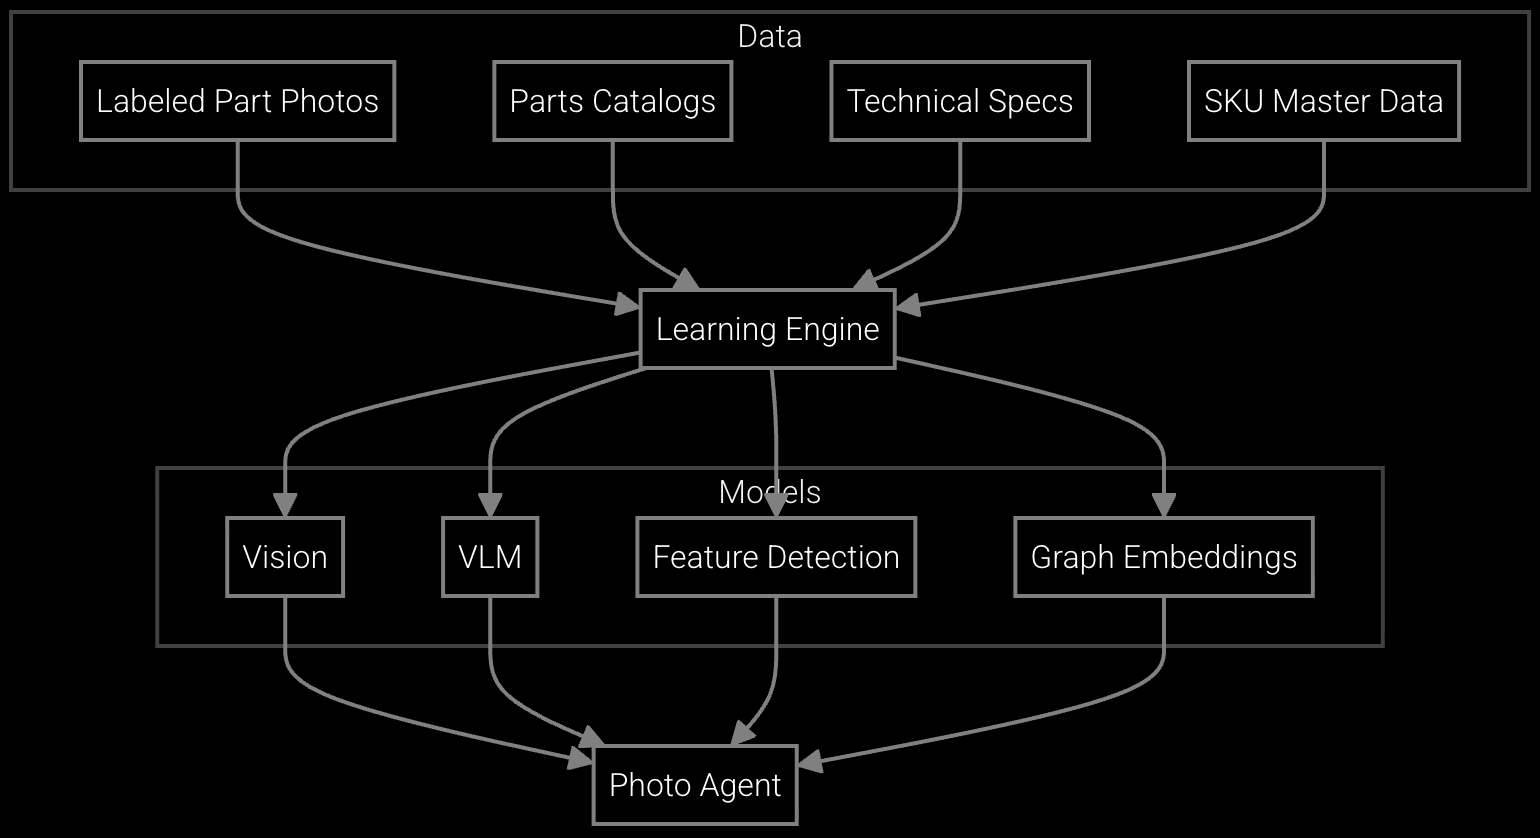
Snap a photo of a failed server component and get instant part number identification, stock availability across warehouses, and substitute compatibility—no manual catalog lookup needed.
Data center OEMs face compressed hardware lifecycles—a server generation ships for 18-24 months before architectural refresh. During that window, component failures follow predictable bathtub curves, but demand spikes vary wildly based on customer workload patterns, thermal stress, and power quality.
Your inventory must balance regional warehouse stock for same-day fulfillment against the risk of obsolescence when the next CPU generation launches. BMC telemetry provides real-time failure signals, but translating those into accurate demand forecasts across SKUs and geographies requires machine learning models trained on your specific install base. The platform's API architecture allows your team to build these models without replacing existing inventory systems.
Most data center OEMs see positive ROI within 6-9 months. The payback calculation depends on current carrying cost percentage, emergency shipment frequency, and SLA penalty exposure. For large installed bases with distributed warehouses, savings from reduced stockouts alone often cover implementation costs within the first year.
Compare mean absolute percentage error (MAPE) between current replenishment logic and AI-driven forecasts. Data center parts typically show 30-50% MAPE reduction on high-turnover SKUs like power supplies and drives. Track fill rate and stockout frequency as lagging indicators—these should improve within 2-3 replenishment cycles as the models learn seasonal patterns.
Yes. Bruviti's Python SDK provides REST API endpoints that return forecasts as JSON with confidence intervals. Your data engineers call the API from existing replenishment workflows, preserving business logic around safety stock rules and vendor lead times. The integration is stateless and doesn't require migrating master data out of your ERP.
BMC telemetry provides the strongest signal—temperature anomalies, drive SMART stats, and memory correctable errors predict failures weeks in advance. Combining this with warranty claim history, installed base age distribution, and customer workload patterns (CPU utilization, I/O throughput) improves forecast precision. The platform handles multi-modal data fusion via the API.
TCO includes platform subscription cost, data integration effort (typically 2-4 weeks for a data engineer), and ongoing model training compute. Offset this against savings from reduced carrying costs (15-25% of inventory value annually), avoided emergency shipments (40-60% reduction), and eliminated SLA penalties (70-80% decrease). For OEMs with $10M+ in parts inventory, annual net savings typically exceed $1.5-2M.

SPM systems optimize supply response but miss demand signals outside their inputs. An AI operating layer makes the full picture visible and actionable.
Advanced techniques for accurate parts forecasting.

AI-driven spare parts optimization for field service.
See how AI-driven forecasting reduces carrying costs and prevents stockouts across your distributed warehouses.
Schedule Technical Demo