Seasonal spikes and decades of SKU legacy make inventory forecasting a margin killer for home appliance OEMs.
Bruviti deployment data shows 400+ engineering hours saved per month and a 70% cut in catalog authoring time after parts intelligence is deployed. Appliance OEMs recover skilled engineering capacity that previously went to manual catalog and blueprint work, turning a recurring labor cost into reusable, searchable parts data.
Appliance OEMs maintain parts for 15+ year product lifecycles across refrigerators, washers, HVAC units, and kitchen equipment. Conservative demand forecasting leads to overstocking, tying up capital in slow-moving SKUs that may never ship.
HVAC components surge during summer heat waves and winter cold snaps. Refrigeration parts spike during holidays. Water heater elements fail in clusters. Traditional forecasting models struggle with weather-driven unpredictability and regional variation.
When stockouts delay in-home repairs for washers or refrigerators, expedited shipping becomes mandatory to meet SLAs. Overnight freight and direct-to-consumer deliveries cost 4-8x standard shipping, eroding service margins on every rushed order.
Bruviti's platform provides Python and TypeScript SDKs that integrate with SAP, Oracle, and custom ERP systems to forecast parts demand using installed base telemetry, service history, and external signals like weather data. The headless architecture means you own the integration layer—no vendor lock-in, no forced UI adoption, no migration costs if your data architecture evolves.
For builders, the ROI equation centers on integration speed and maintenance burden reduction. Pre-trained models eliminate 6-12 months of internal ML development. Open APIs mean you customize forecasting logic for seasonal spikes, substitute parts matching, and multi-location inventory balancing without rewriting core inference code. You deploy once and iterate on rules, not infrastructure.
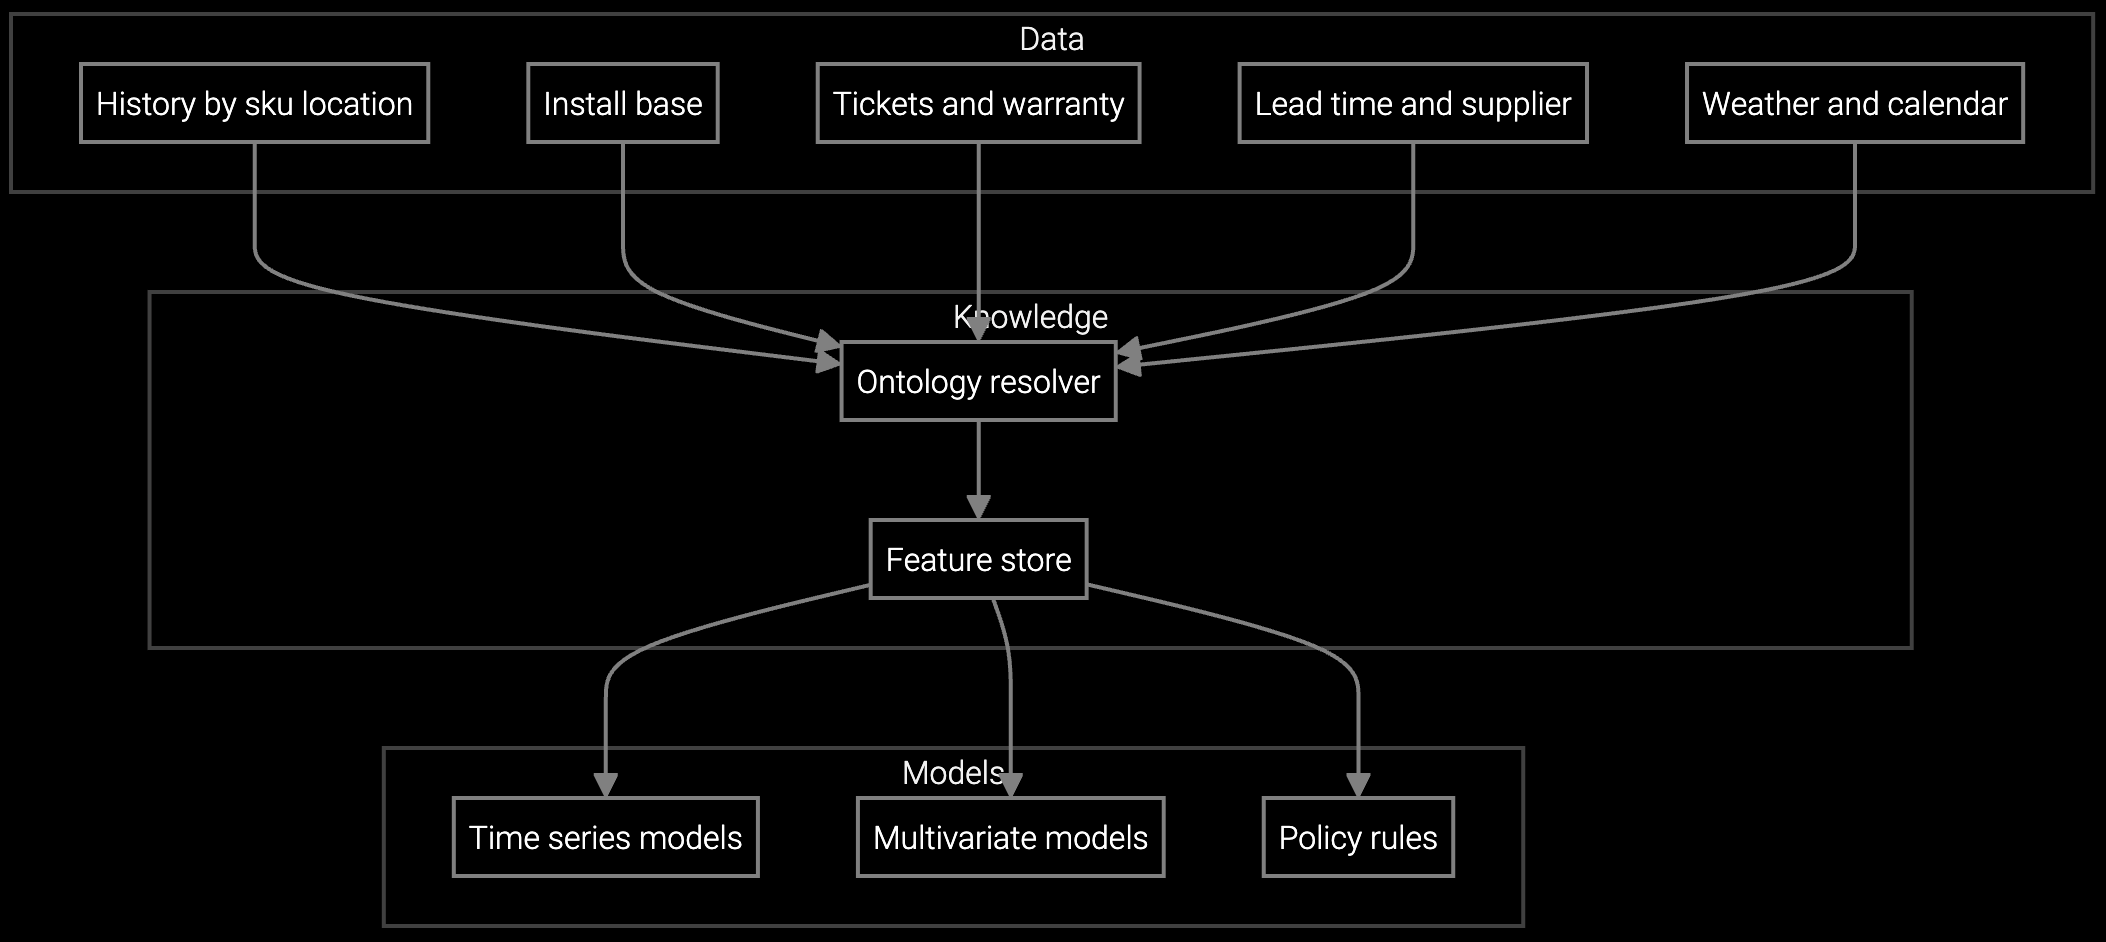
Projects HVAC compressor, refrigerator seal, and washer pump consumption based on installed base age, seasonal patterns, and regional climate data for appliance OEMs.
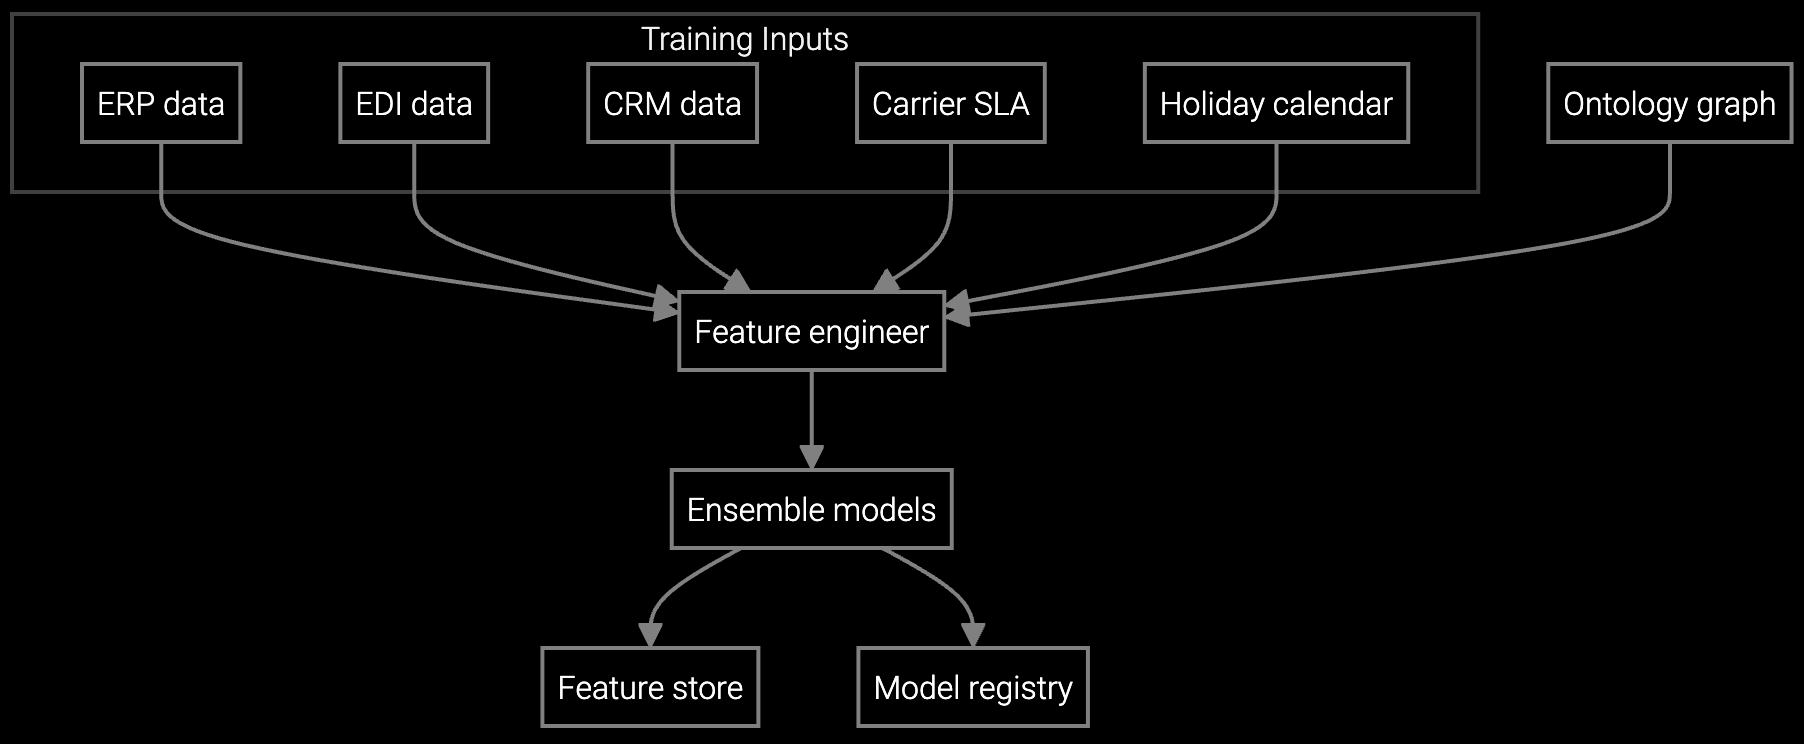
Forecasts demand by warehouse location and time window, optimizing stocking levels for seasonal appliance part spikes while minimizing capital tied up in slow movers.
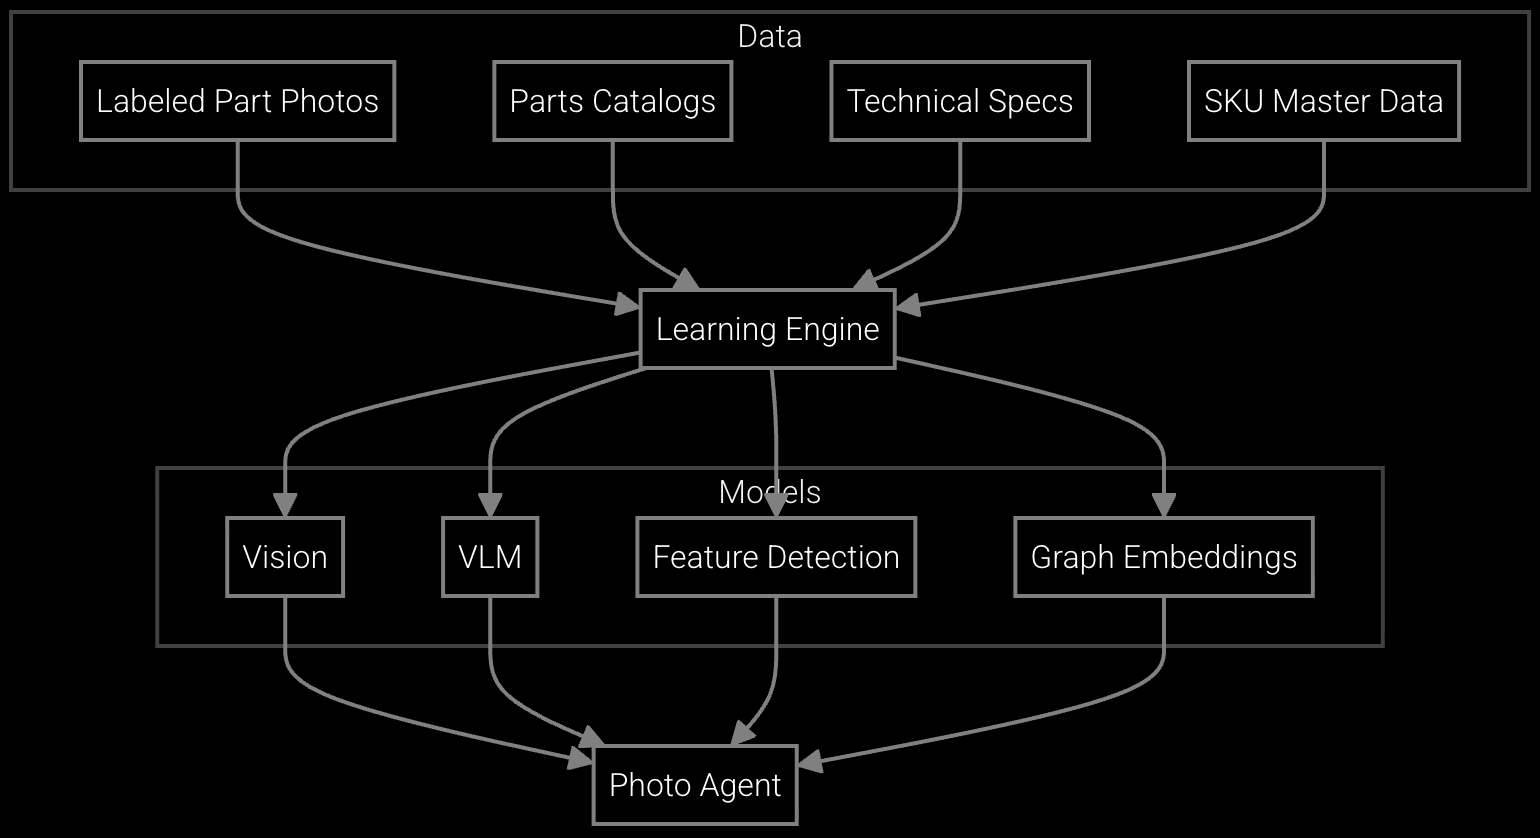
Snap a photo of a dishwasher pump or refrigerator fan motor and get instant part number identification with cross-reference to compatible substitutes and real-time availability.
For a mid-sized appliance manufacturer managing 12,000 SKUs across refrigerators, washers, dryers, dishwashers, and HVAC systems, inventory carrying costs typically run 18-25% of total inventory value annually. A $15M parts inventory incurs $2.7M-$3.75M in carrying costs (warehouse space, obsolescence reserves, capital cost). Reducing inventory by 20% through better demand forecasting saves $540K-$750K per year.
Emergency shipments represent another major cost center. If 8% of service calls require expedited parts at a $110 premium over standard freight, and you process 80,000 warranty and out-of-warranty service events annually, that's $704K in avoidable shipping costs. Improving fill rate from 87% to 96% recovers most of this margin leakage. Combined with inventory reduction, total annual savings range from $1.2M-$1.5M against implementation costs of $180K-$280K (API integration labor plus platform fees), yielding 6-9 month payback.
Establish baseline metrics for carrying cost percentage, fill rate, and emergency shipment frequency across a control group of SKUs not using AI forecasting. Compare 90-day rolling averages between control and treatment groups to measure incremental lift. Most appliance OEMs see statistically significant differences within 6-8 weeks for high-velocity parts like HVAC filters and refrigerator water filters.
Installed base age and service history provide 60-70% of predictive power for appliance parts. Adding regional weather data (for HVAC and refrigeration) improves accuracy by another 10-15%. Connected appliance telemetry (runtime hours, cycle counts, error codes) boosts accuracy further but requires IoT infrastructure investment. Start with service history and installed base—most ROI comes from those two signals alone.
Yes. Bruviti's Python SDK allows you to train separate models by brand tier, since premium appliances often have different failure curves and customer replacement behaviors. You can also segment by sales channel (builder/contractor vs. retail) if your service data captures that dimension. The API accepts custom feature sets and model parameters without requiring retraining from scratch.
HVAC components represent 30-40% of emergency shipment costs for most appliance OEMs due to extreme weather unpredictability. Capturing even half of those savings shortens payback by 2-3 months. If your portfolio skews heavily toward HVAC, expect payback closer to 6 months. Washers, dryers, and dishwashers have more stable demand curves, yielding steadier but slower ROI accumulation around 9-12 months.
Most appliance OEMs complete SAP or Oracle integration in 4-8 weeks with 1-2 full-time developers. The SDK provides pre-built connectors for major ERP systems. Custom data pipelines (for telemetry from connected appliances or proprietary service systems) add 2-4 weeks. Plan for $80K-$140K in internal labor costs assuming blended rates of $120-$160/hour for backend and data engineers.

SPM systems optimize supply response but miss demand signals outside their inputs. An AI operating layer makes the full picture visible and actionable.
Advanced techniques for accurate parts forecasting.
AI-driven spare parts optimization for field service.
Run a custom forecast accuracy assessment on your parts data using Bruviti's SDK in a 30-day pilot.
Schedule Technical Demo