Hyperscale operations demand precision forecasting before adding AI to dispatch, diagnostics, or BMC telemetry pipelines.
Bruviti deployment data shows AI cuts service call volume 35% and lowers average handling time 22% for data center hardware support. Builders calculate ROI from deflected calls, faster resolution, and fewer repeat visits, each tied to a measured deployment metric rather than a projection.
Low first-time fix rates at hyperscale facilities mean every missed diagnosis doubles technician travel time, parts shipping, and customer SLA exposure. Traditional models underestimate the compounding cost of repeat visits across thousands of deployed servers.
Connecting AI systems to BMC/IPMI telemetry streams, FSM work order APIs, and parts inventory databases requires significant engineering effort. Most ROI calculations ignore the months of schema mapping, data quality remediation, and authentication setup.
When technicians spend 30-40% of their day on low-complexity power supply swaps or drive replacements that could be triaged remotely, labor efficiency metrics degrade. ROI models must capture the opportunity cost of expert time on routine tasks.
Start by modeling three distinct cash flow impacts: avoided truck rolls through remote triage, improved FTF through pre-dispatch diagnostics, and higher technician throughput by routing low-skill work to automated resolution. Bruviti's API-first architecture lets you instrument each decision point in your dispatch workflow and measure actual resolution rates before and after AI intervention.
For data center OEMs, the calculation must account for BMC telemetry infrastructure you already own. If you're pulling IPMI data from deployed servers, the platform ingests those streams via REST APIs without requiring proprietary agents or middleware. Integration cost drops to schema mapping and authentication setup rather than hardware retrofits. Factor your engineering team's runway: Python SDKs mean your data engineers can prototype parts prediction or failure classification models in weeks, not quarters, reducing time to measurable ROI.
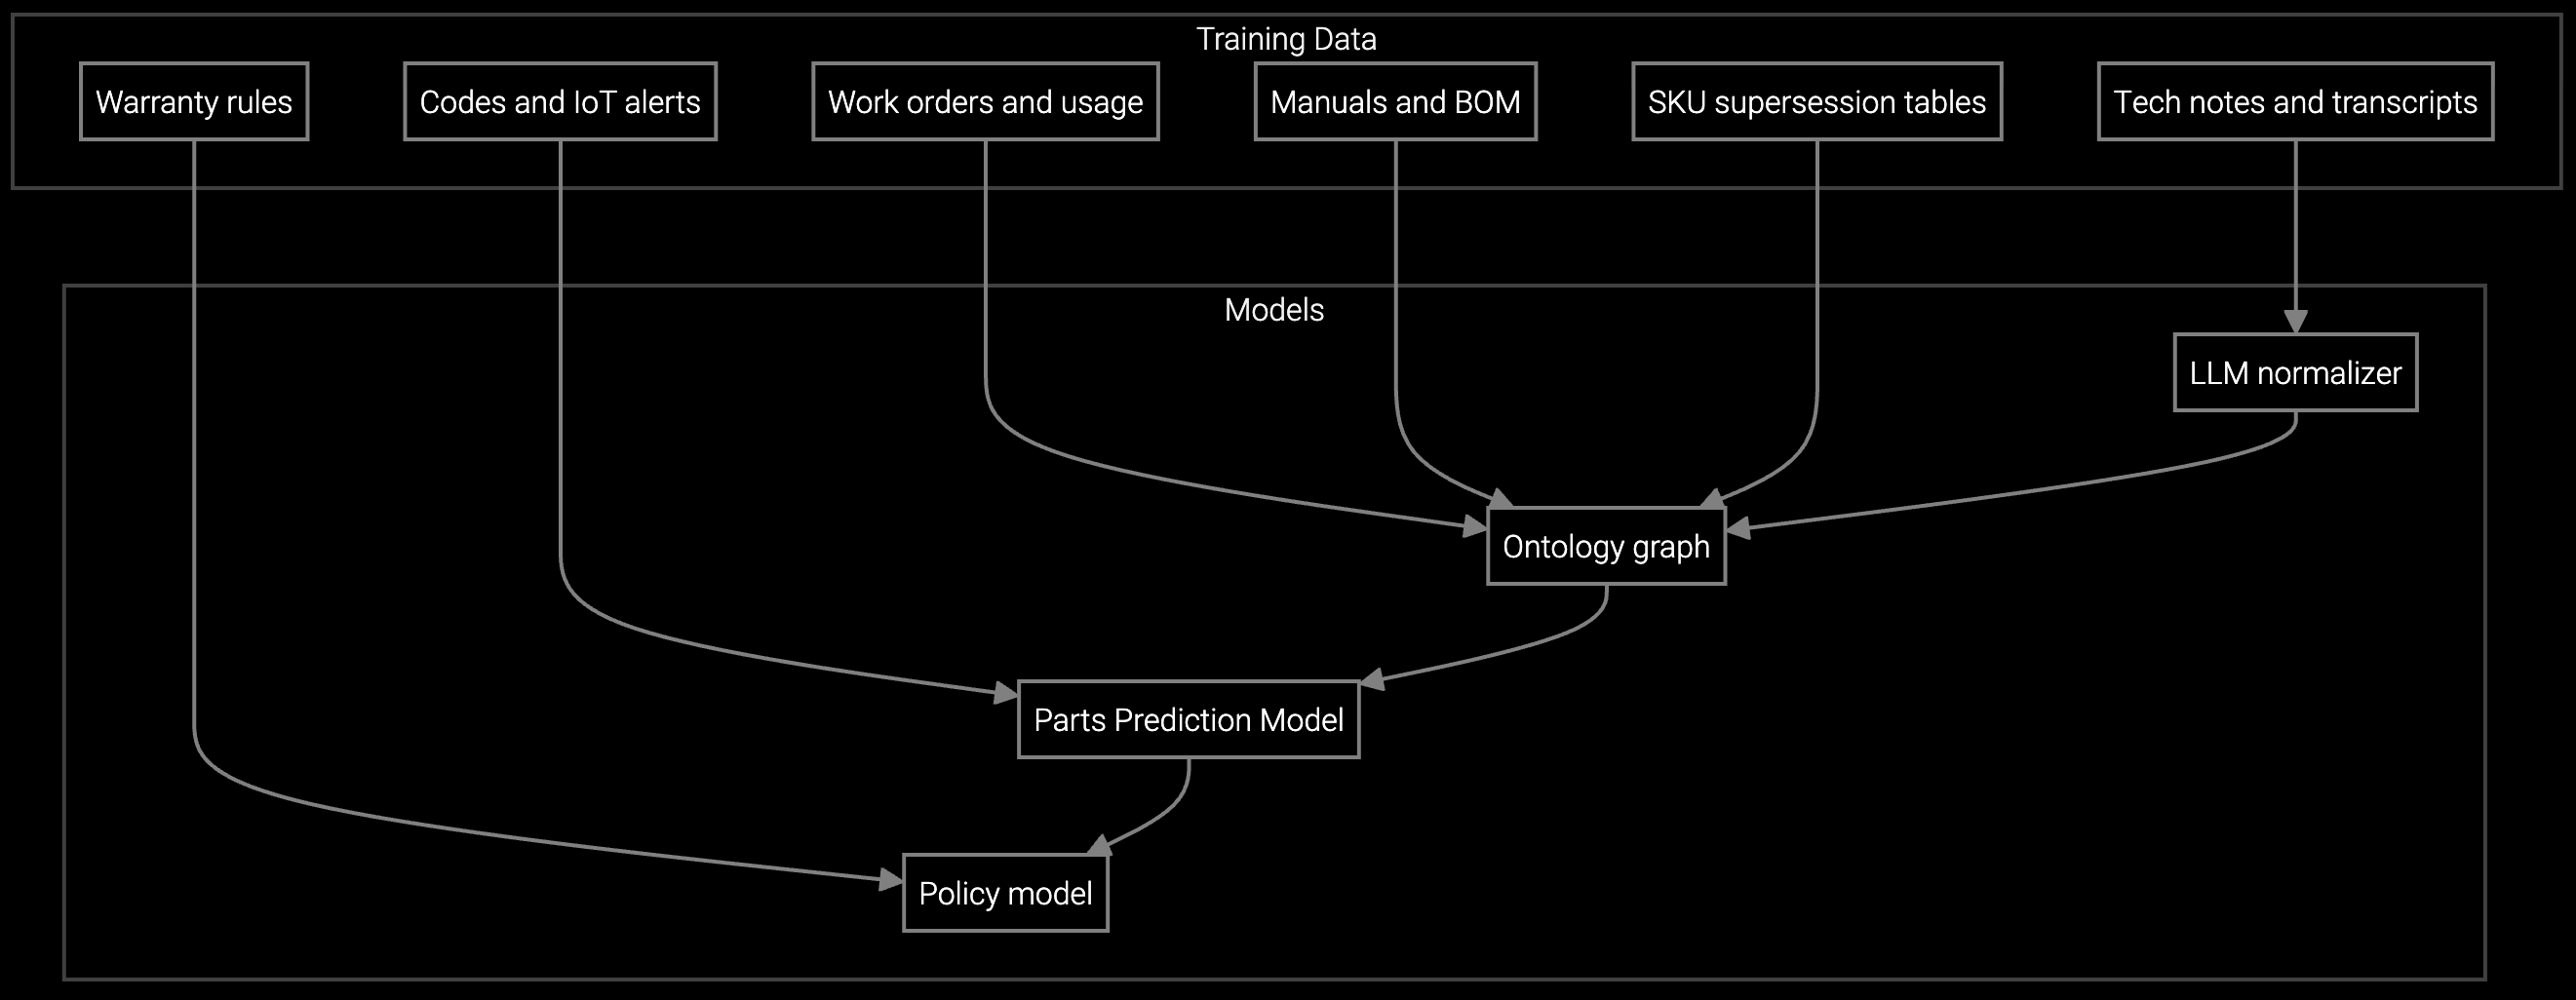
Predicts which power supplies, drives, or memory modules technicians need before dispatch to data center facilities, cutting repeat visits by 50% and improving first-time fix rates to 85%+ in hyperscale environments.
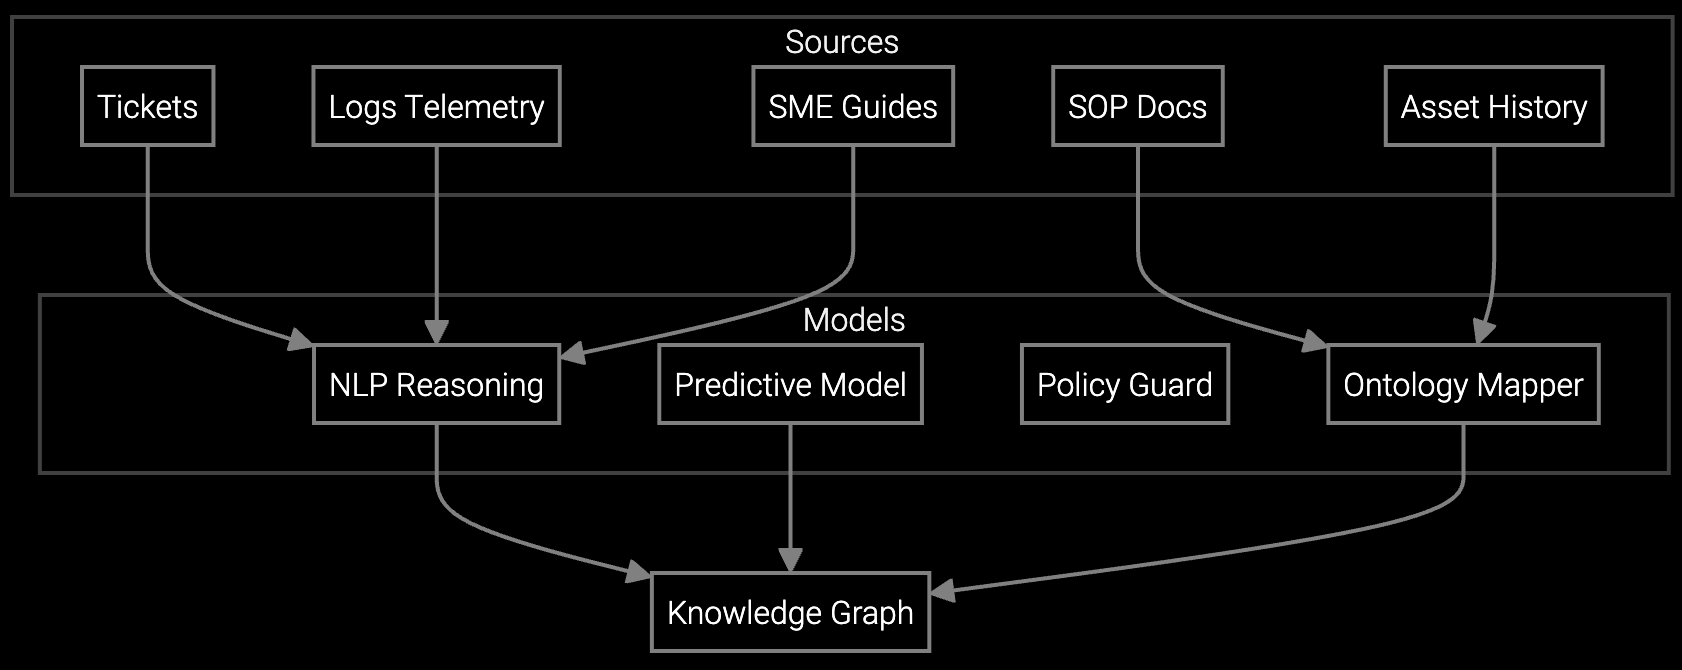
Correlates BMC/IPMI telemetry patterns with historical server failure data to identify root causes faster, reducing mean time to repair for thermal anomalies and power distribution faults in high-density racks.
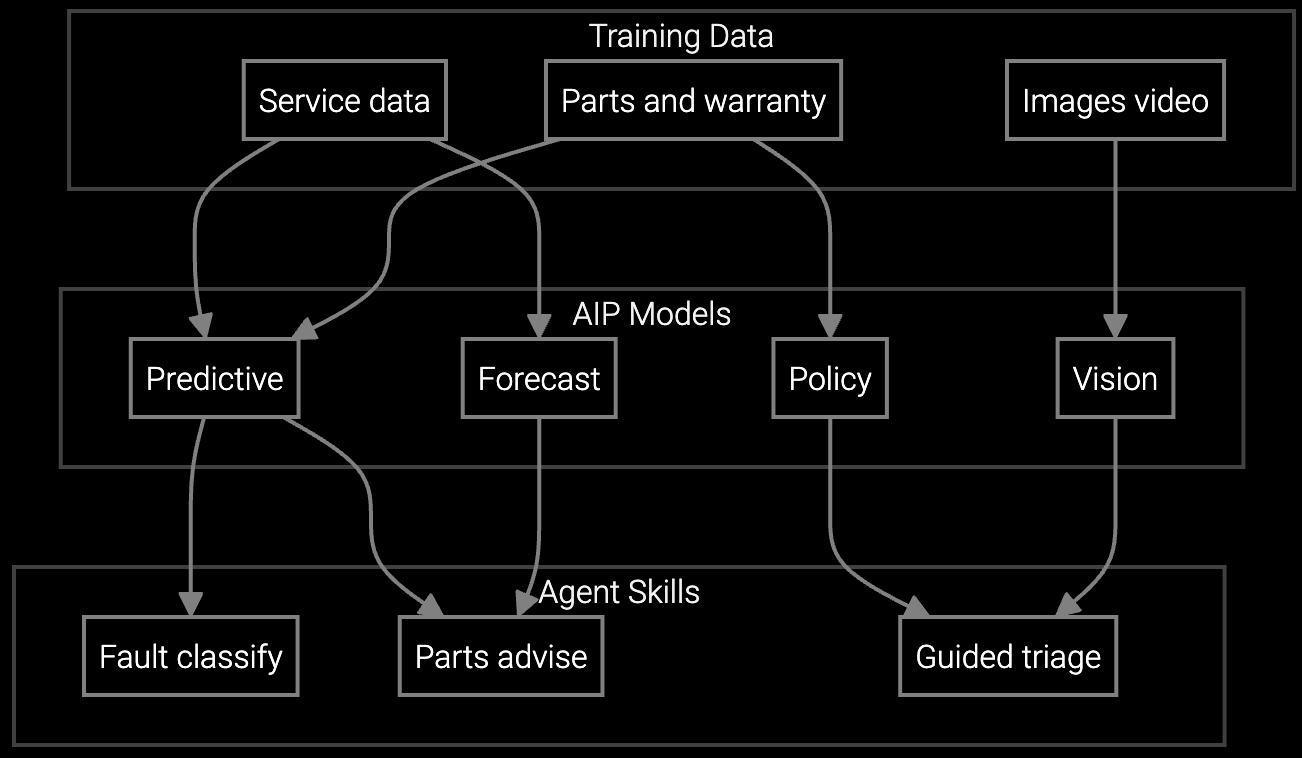
Mobile copilot provides real-time guidance on server diagnostics, RAID rebuild procedures, and firmware update sequences during on-site visits, cutting resolution time by 30-40% for complex multi-component failures.
Hyperscale customers operate 50,000+ servers per facility with PUE targets below 1.2, making every hour of downtime a six-figure liability. Your ROI model must reflect the difference between routine drive swaps (low margin, high volume) and complex cooling or power distribution failures (high margin, high SLA risk). BMC telemetry streams already flowing from deployed servers provide the training data for predictive models—integration cost is API configuration, not hardware retrofits.
Data center dispatch economics differ sharply from enterprise IT: technicians serve dense racks of homogeneous hardware rather than diverse endpoints. This concentration amplifies both the cost of low FTF (one missed part affects 40 servers in a hot aisle) and the ROI of predictive dispatch (pre-staging reduces MTTR by 2-4 hours). Your calculation should model truck roll cost per rack rather than per server, capturing the batch efficiency of on-site visits to collocated equipment.
Budget 2-4 engineering months for initial API integration with your field service management platform and BMC/IPMI streams. Most effort goes to schema mapping and authentication setup rather than custom code. REST APIs and Python SDKs minimize middleware complexity. If you already pull IPMI data for monitoring, adding AI inference endpoints typically takes 4-6 weeks.
Track FTF rate by work order type before and after AI deployment, segmenting by failure mode (thermal, power, storage, network). Use control groups where technicians receive standard dispatch instructions versus AI-guided parts lists. A 10-15 percentage point FTF improvement over 90 days, holding dispatch volume constant, indicates measurable AI contribution. Log all AI recommendations to calculate precision and recall against actual parts consumed.
Yes. The platform supports both cloud-hosted and on-premises inference deployment using containerized models. You control where telemetry data flows—train models on historical data in your private cloud, then deploy inference containers alongside your FSM system. API architecture decouples data residency from model updates, so you can refresh models without moving sensitive server telemetry outside your network.
You need 6-12 months of IPMI telemetry (temperature, voltage, fan speed, error logs) correlated with completed work orders showing actual failure modes and parts replaced. Data completeness matters more than volume—missing timestamps or unstructured failure descriptions degrade model accuracy. If your BMC data lacks work order correlation, budget 2-3 months for data pipeline setup before training predictive models.
Segment your customer base by SLA tier and calculate weighted average penalty exposure per hour of downtime. Track AI-driven MTTR reduction separately for high-SLA customers versus standard contracts. Multiply hours saved by tier-specific penalty rates to estimate avoided costs. For data center OEMs, hyperscale customers often carry 5-10x higher penalty exposure than mid-market accounts, so a 2-hour MTTR improvement on critical infrastructure generates disproportionate ROI.

How AI bridges the knowledge gap as experienced technicians retire.
Generative AI solutions for preserving institutional knowledge.

AI-powered parts prediction for higher FTFR.
Connect your BMC streams and FSM APIs to calculate truck roll reduction and FTF improvement specific to your deployed footprint.
Talk to an Engineer