Every truck roll drains margin while seasonal HVAC spikes overwhelm dispatch—knowing where dollars leak makes prevention buildable.
The biggest cost line in appliance field service is the truck roll, averaging $250 each, per Bruviti deployment data. One OEM eliminated about 30,000 return visits, a direct saving of roughly $7.5 million. AI parts prediction attacks this line directly by raising first-time fix and removing the second trip.
Second truck rolls cost twice as much as the first—travel time, technician wages, and customer dissatisfaction accumulate. Missing parts or misdiagnosis turns a $200 job into a $450 margin drain.
Technician vans carry $3,000-5,000 in parts inventory per vehicle, yet 30% of jobs require a return trip for a missing component. Dead stock ties up capital while critical parts stockout.
Summer HVAC demand spikes double dispatch volume in peak weeks. Overtime labor, contract technicians, and missed SLAs during surges erode Q2/Q3 margins predictably every year.
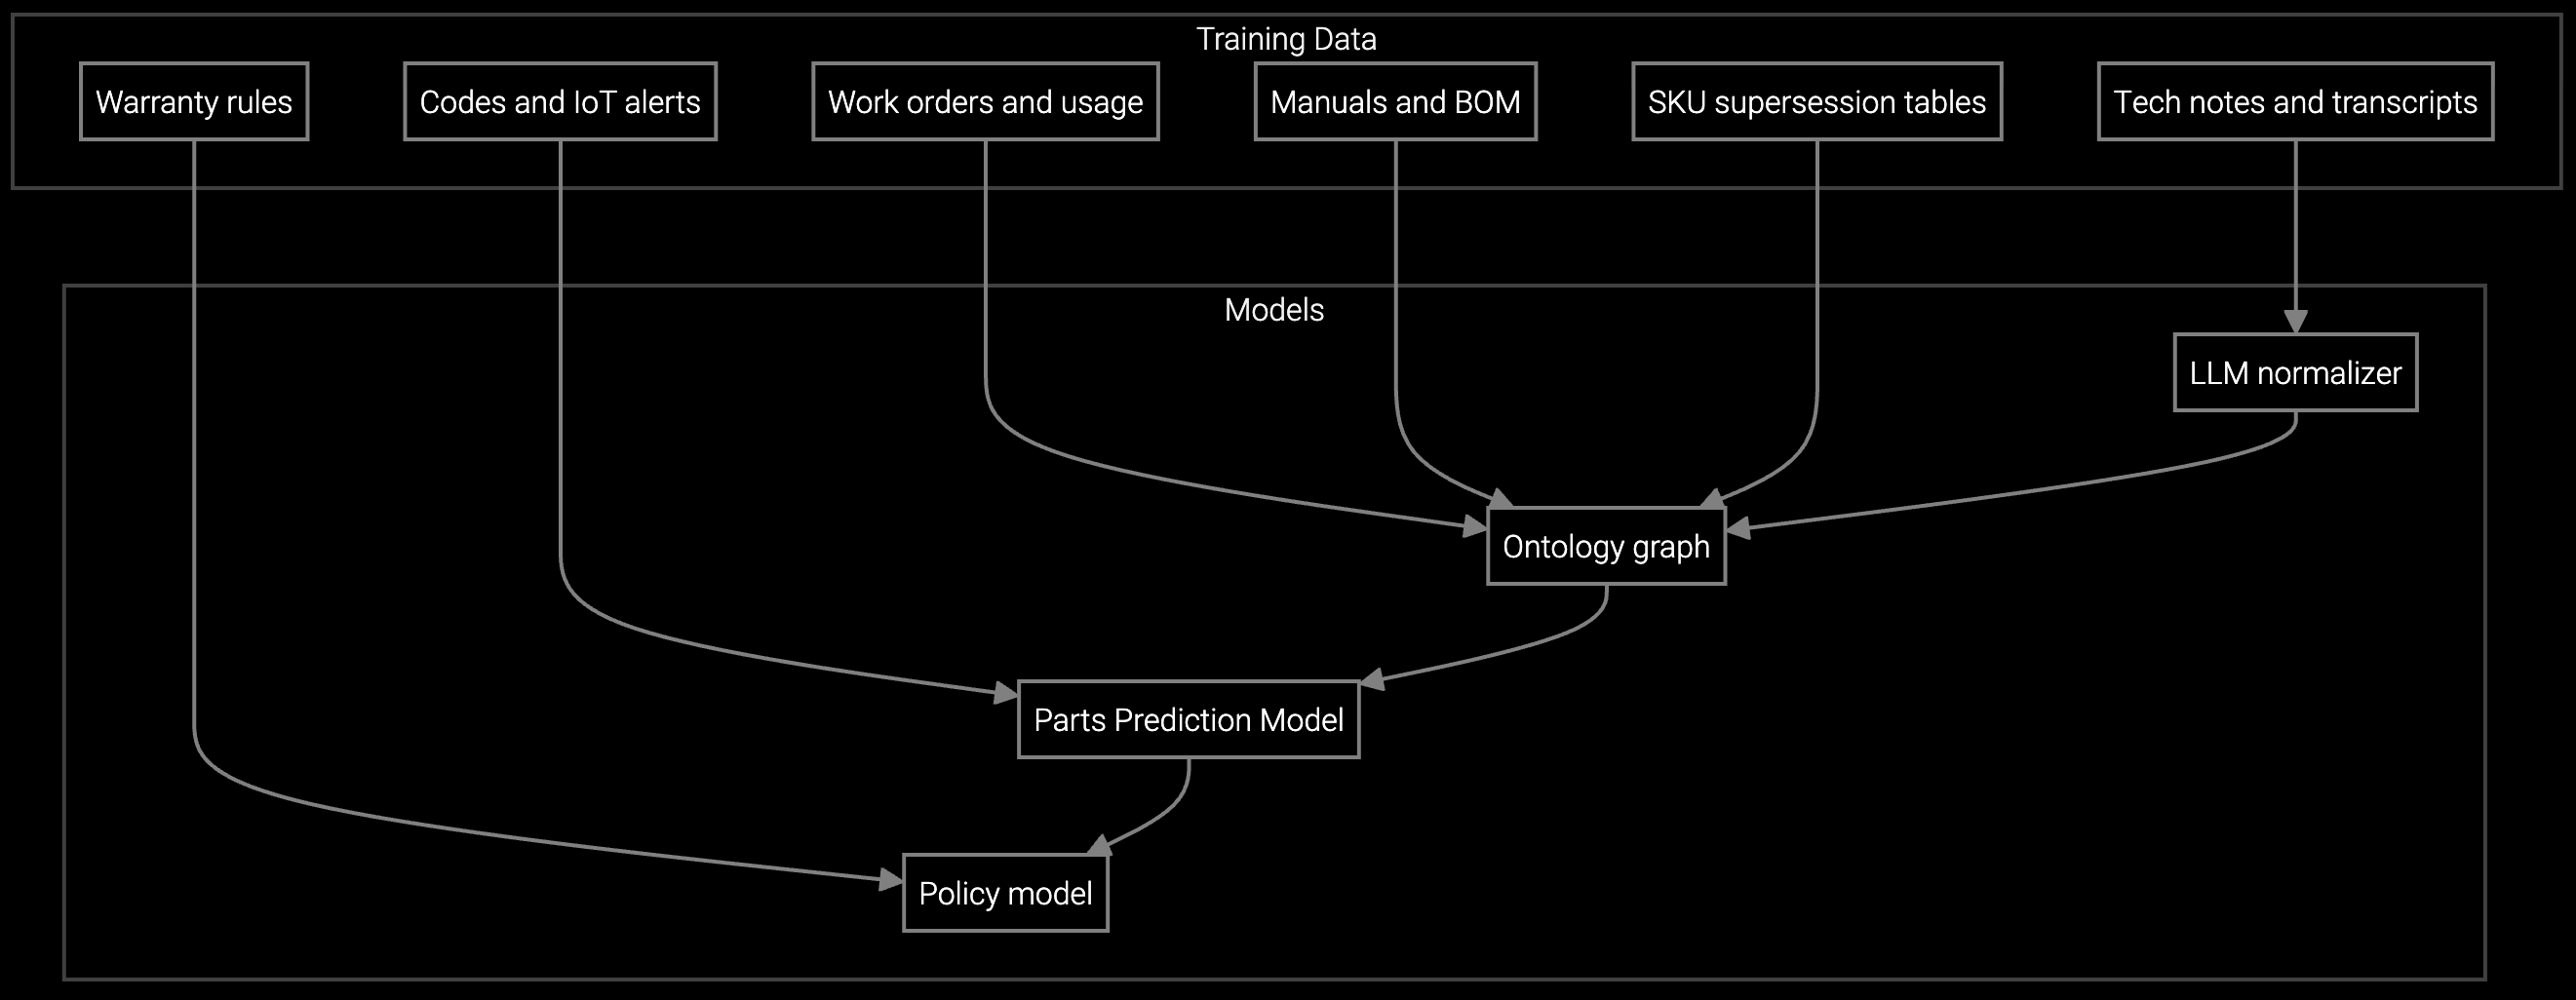
Bruviti's platform ingests work order history, parts consumption logs, and appliance telemetry to predict which parts a technician will need before dispatch. The prediction model runs as a Python microservice—your team controls the API integration with your FSM system, determines confidence thresholds, and customizes fallback logic when predictions are uncertain.
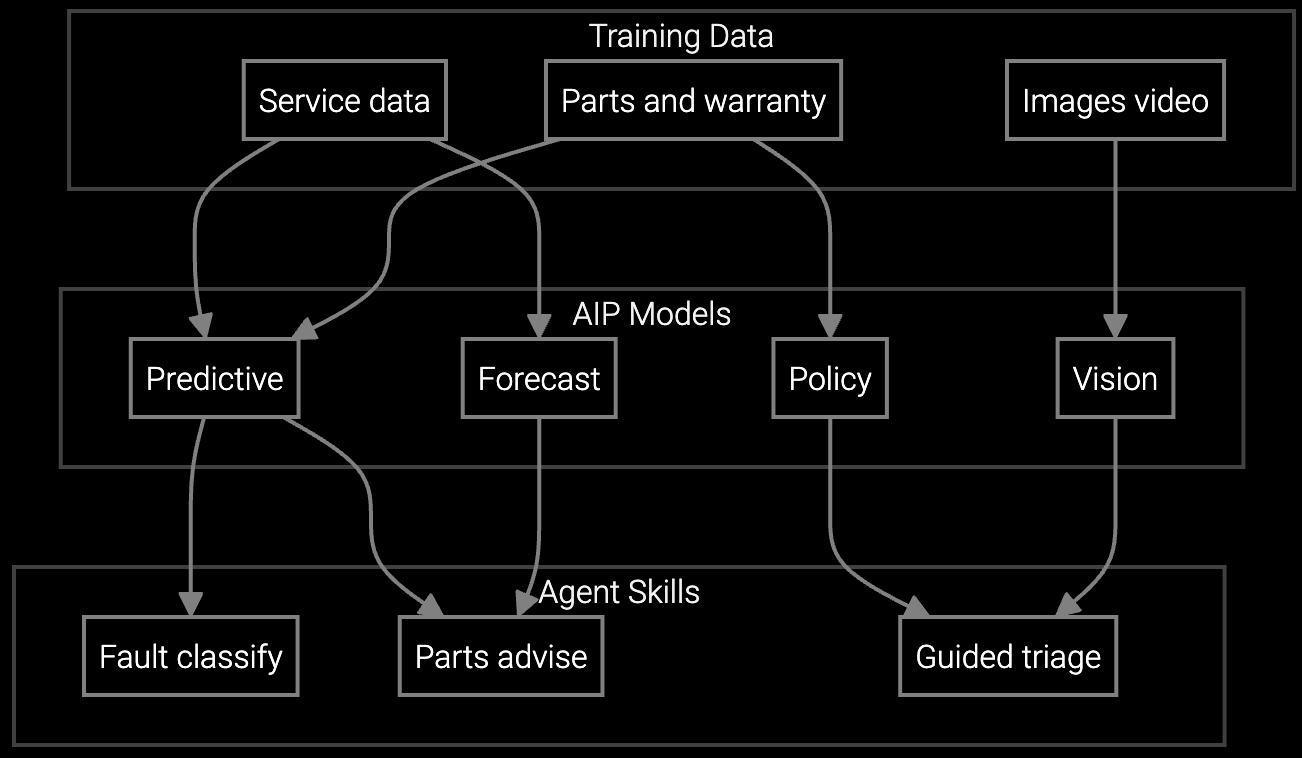
Remote diagnostics APIs let you triage issues before dispatching. A refrigerator throwing error codes gets analyzed against symptom libraries; if the fix is simple (door seal adjustment, temperature recalibration), the platform generates step-by-step instructions for customer self-service. Your developers decide which issue types route to self-service vs. technician dispatch—the platform provides the intelligence layer, you own the workflow orchestration.
Predict which refrigerator compressor or HVAC control board a technician needs before dispatch, stocking vans with 92% accuracy based on appliance model and symptom codes.
Correlate dishwasher leak patterns with historical failure data to identify root cause faster, reducing diagnostic time on-site and improving fix accuracy.
Mobile copilot delivers repair procedures and wiring diagrams for commercial ovens or water heaters in real time, accessible via technician app during on-site diagnosis.
Appliance manufacturers operate on thin margins—2-4% warranty cost targets leave little room for inefficient field service. High-volume, low-margin products like dishwashers and microwaves require cost control at every dispatch. Seasonal HVAC surges create predictable spikes where overtime and contract labor erode Q2/Q3 profitability.
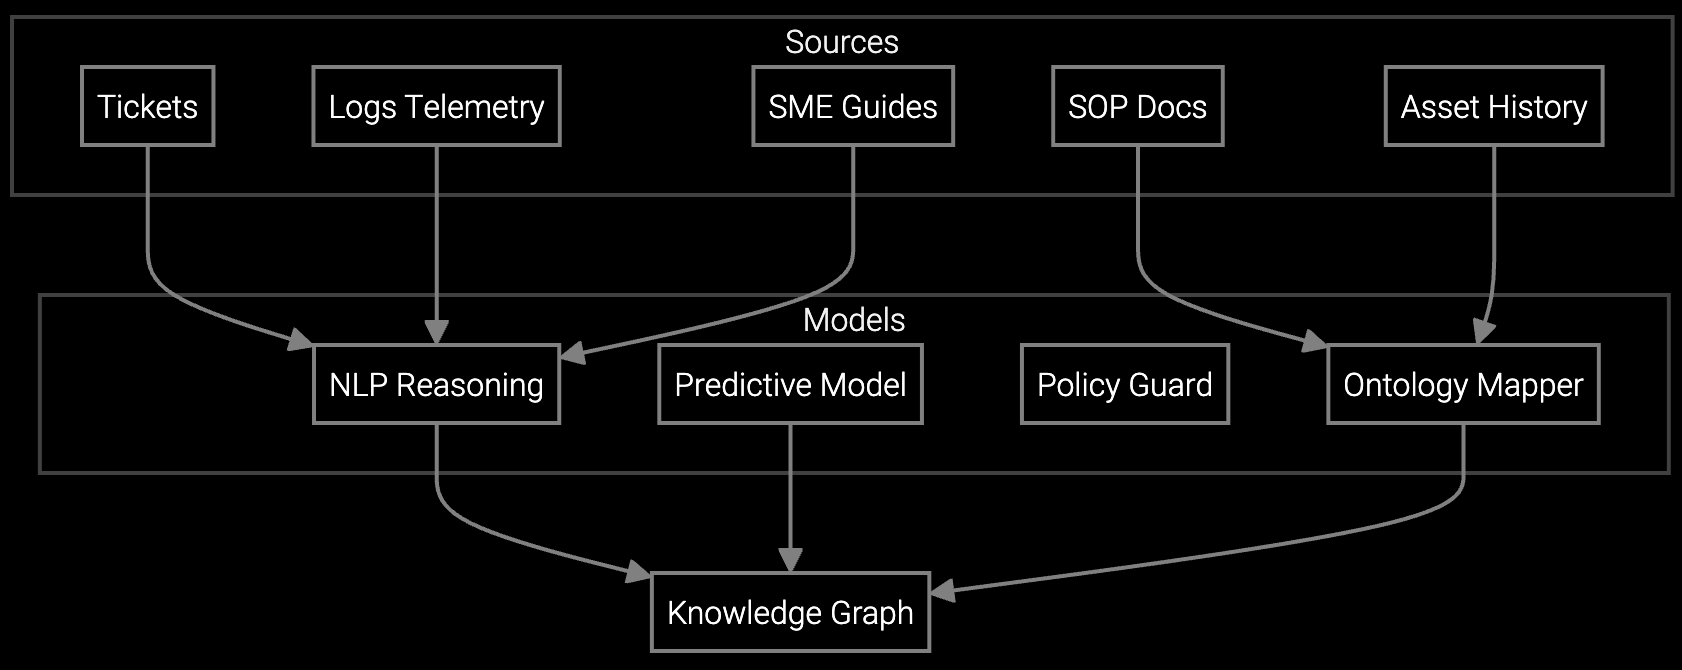
Connected appliances generate telemetry (compressor runtime, error codes, temperature logs) that enables predictive intervention before customer complaints. But raw IoT data doesn't reduce truck rolls—it requires diagnostic logic that routes issues correctly: self-service for simple fixes, parts pre-staging for known failures, technician dispatch only when necessary. Building this logic in-house means training models on historical work orders, parts consumption, and failure patterns—expensive and slow to maintain across product lines.
Truck roll cost includes technician wages (drive time + on-site time), vehicle depreciation and fuel, parts consumed or restocked, and overhead allocation (dispatch coordination, admin). For appliance manufacturers, fully loaded cost runs $150-300 per visit depending on geography and technician seniority. Repeat visits double this cost while adding customer dissatisfaction and NPS impact.
First-time fix rate measures whether the technician resolved the issue without a return visit—target 75%+ for mature appliance service operations. Cost per job tracks total spend per work order including labor, travel, and parts. Technician utilization shows billable time vs. travel time—higher utilization means better routing and fewer wasted trips. Track these monthly and compare before/after AI deployment to quantify ROI.
Bruviti provides REST APIs and Python SDKs that integrate with existing field service management platforms—no need to replace your FSM. The platform ingests work order history and parts data via API, runs prediction models, and returns recommendations (parts needed, triage decision, repair instructions) back to your FSM for dispatch execution. Your developers control integration logic, authentication, and data flow—Bruviti provides the intelligence layer, not a walled-garden replacement.
Historical work orders with completed job details (appliance model, symptom codes, parts consumed, resolution outcome) provide the training foundation. At least 12 months of data across product lines ensures the model learns seasonal patterns and common failure modes. Connected appliance telemetry (error codes, runtime logs) improves prediction accuracy but isn't required to start—many manufacturers achieve 85%+ prediction accuracy using work order history alone.
Calculate baseline repeat visit rate (percentage of jobs requiring a second truck roll) and multiply by average truck roll cost to quantify current waste. After deploying AI-driven parts prediction and remote triage, track the new repeat visit rate over 90 days. Each percentage point reduction in repeat visits translates directly to margin improvement—if you dispatch 10,000 jobs annually at $200 per truck roll with a 25% repeat rate, reducing repeats to 15% saves $200,000 annually.

How AI bridges the knowledge gap as experienced technicians retire.
Generative AI solutions for preserving institutional knowledge.

AI-powered parts prediction for higher FTFR.
Connect Bruviti's prediction APIs to your FSM system and start tracking first-time fix improvements in weeks, not quarters.
Schedule Technical Demo