When missing parts delay SLA commitments, hyperscale customers notice—and contract renewals hang in the balance.
Bruviti deployment data shows AI demand forecasting reduces stockouts by 40% or more, ending the delays that hold up data center service. The platform predicts which parts each site needs before failures occur, so service is not blocked waiting on inventory. Deployment data attributes the reduction to per-SKU demand sensing.
When a critical power supply or drive fails at a hyperscale facility, overnight freight becomes non-negotiable. The cost differential between ground shipping and same-day air delivery erodes margins on every reactive fulfillment.
Data center customers enforce tight service windows. Missing a 4-hour or 8-hour commitment because the part wasn't in regional inventory triggers contractual penalties that compound over the year.
Static safety stock models overcompensate for unpredictable demand, leaving capital tied up in slow-moving inventory at some locations while others face chronic shortages. Carrying costs accumulate quarter after quarter.
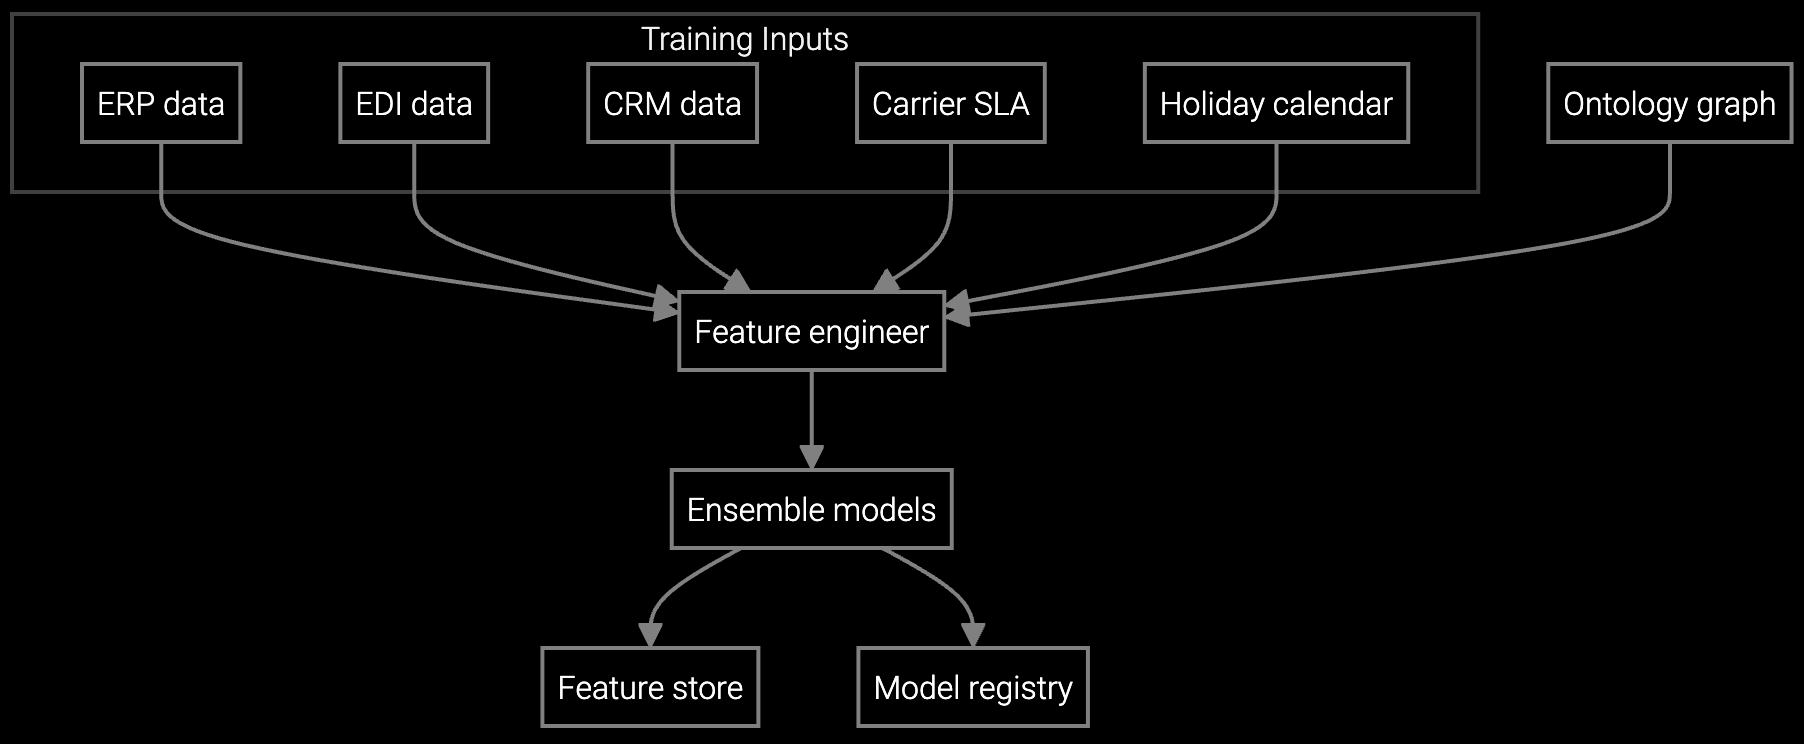
Bruviti's platform ingests telemetry from BMC and IPMI interfaces across your installed base, analyzing thermal events, power anomalies, and drive SMART data to project component failure probability by geography and time window. The system correlates historical service records with current fleet health signals to forecast parts consumption at the regional warehouse level.
Instead of reacting to stockouts after they delay service calls, the platform recommends inventory transfers and replenishment two to four weeks ahead of projected demand surges. Machine learning models continuously refine forecasts as new failure patterns emerge, adapting to hardware generation shifts and seasonal usage spikes without manual intervention.
Forecast demand for PDUs, UPS batteries, and compute components across distributed data center regions, optimizing stock levels while reducing expedited freight costs.
Project server component consumption based on installed base age, thermal stress patterns, and hardware generation lifecycle curves to eliminate stockout risk.
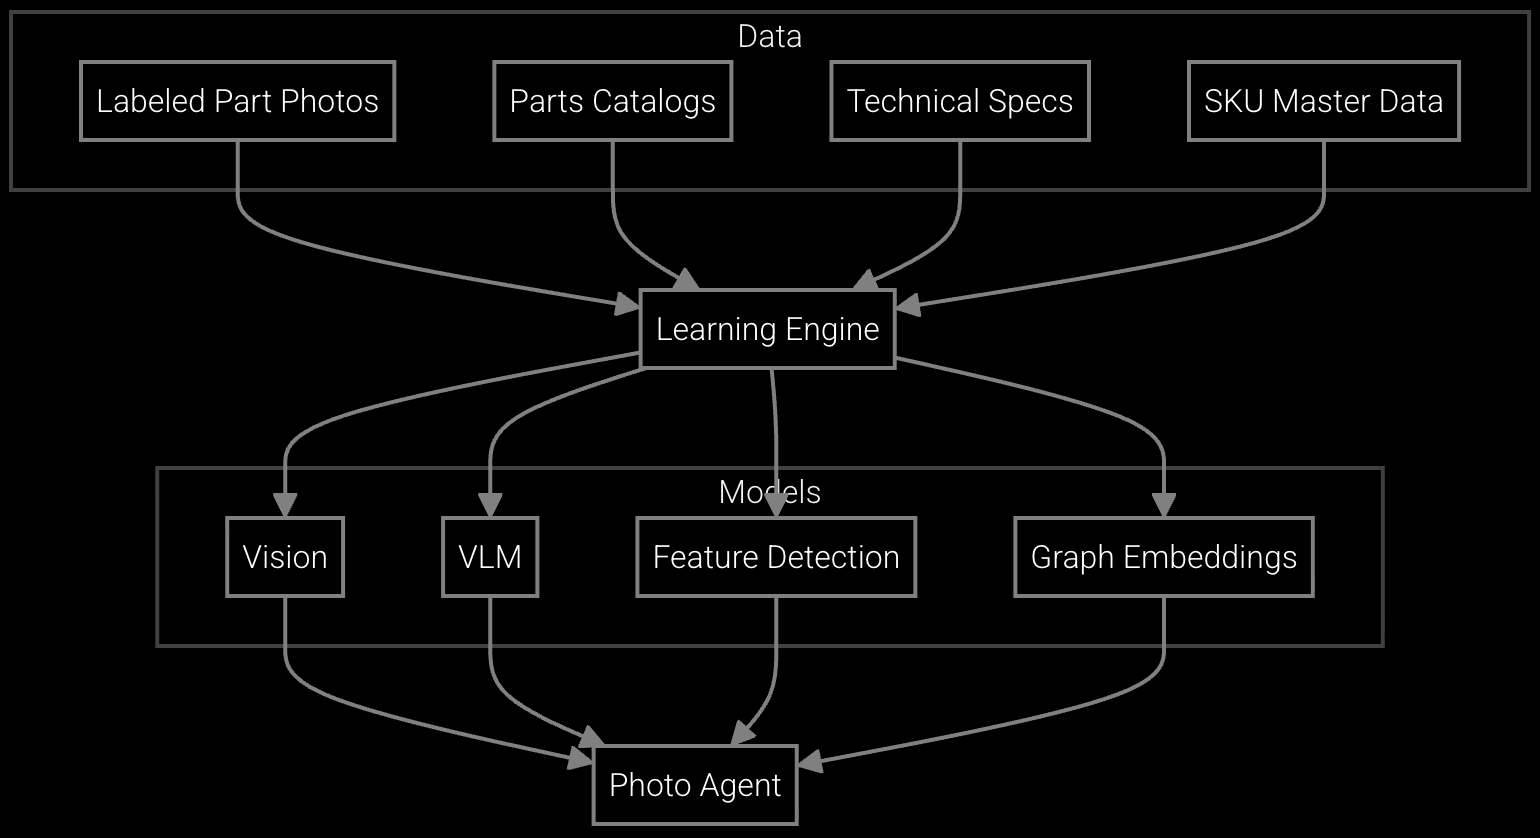
Enable field teams to snap photos of failed components in racks, instantly retrieving part numbers and checking availability across regional warehouses.
Data center OEMs support thousands of server nodes per customer facility, where failure rates compound across massive deployed fleets. A 4% annual hardware failure rate translates to dozens of component replacements per week at hyperscale sites. Traditional demand forecasting treats all inventory as fungible, but power supplies for Gen 3 vs. Gen 5 servers aren't interchangeable—and regional warehouse networks lack visibility into which generations dominate each geography.
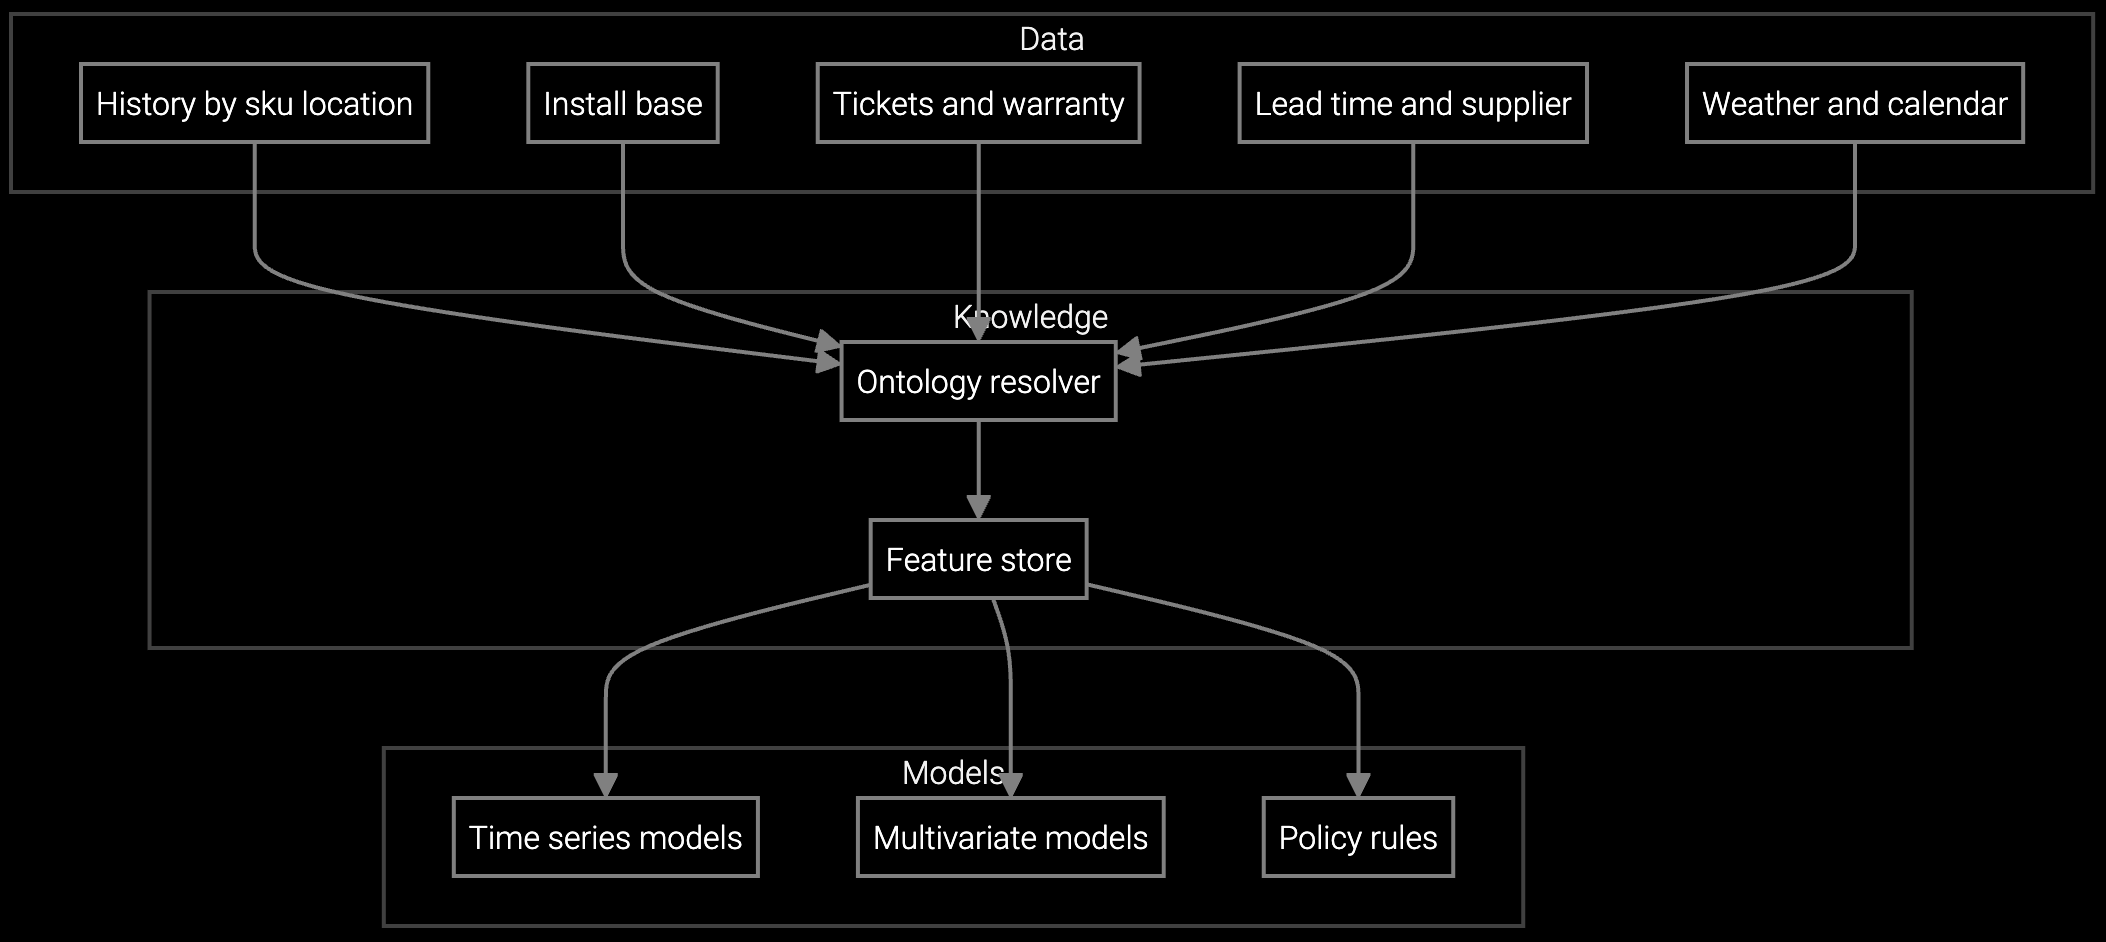
The platform parses BMC telemetry to identify hardware generations and configurations, mapping them to failure probability curves derived from historical service data. It forecasts not just "power supply demand" but "Gen 4 redundant PSU demand in US-West Q2" based on thermal stress patterns and installed base age distribution. This specificity prevents the wrong parts from sitting idle while emergency shipments cover gaps elsewhere.
The system uses transfer learning from similar component families and early-life telemetry patterns to bootstrap forecasts for new hardware. As the installed base ages, actual failure data refines predictions. Initial forecasts rely on vendor MTBF specs adjusted by observed stress conditions, converging toward empirical accuracy within six months.
Most data center OEMs see measurable impact within 90 days as the first inventory repositioning recommendations prevent stockouts. Full ROI—including carrying cost reduction and SLA penalty avoidance—typically materializes in 6-9 months as the model learns seasonal patterns and optimizes safety stock levels across all regions.
Yes. Bruviti connects to SAP, Oracle, and other ERP systems via standard APIs or batch file exchanges. Demand forecasts feed directly into replenishment workflows, and real-time inventory levels inform fulfillment recommendations. The integration preserves existing procurement approvals and supplier relationships.
By forecasting where failures will concentrate, the platform recommends moving high-probability parts to regional warehouses before demand spikes. A PDU forecasted to fail in Phoenix next week ships ground from the central hub today, arriving before the service call. This eliminates the 6-8x cost premium of same-day air freight.
BMC telemetry provides the strongest signal—thermal readings, fan speeds, and power draw anomalies predict imminent failures. Service ticket history adds context on actual consumption patterns. Installed base age and configuration data enable cohort-based modeling. Combining these sources typically improves forecast accuracy by 35-50% over static safety stock rules.

SPM systems optimize supply response but miss demand signals outside their inputs. An AI operating layer makes the full picture visible and actionable.
Advanced techniques for accurate parts forecasting.

AI-driven spare parts optimization for field service.
See how predictive demand forecasting protects margins and SLA commitments across your data center business.
Schedule Demo